Books on Data Visualization

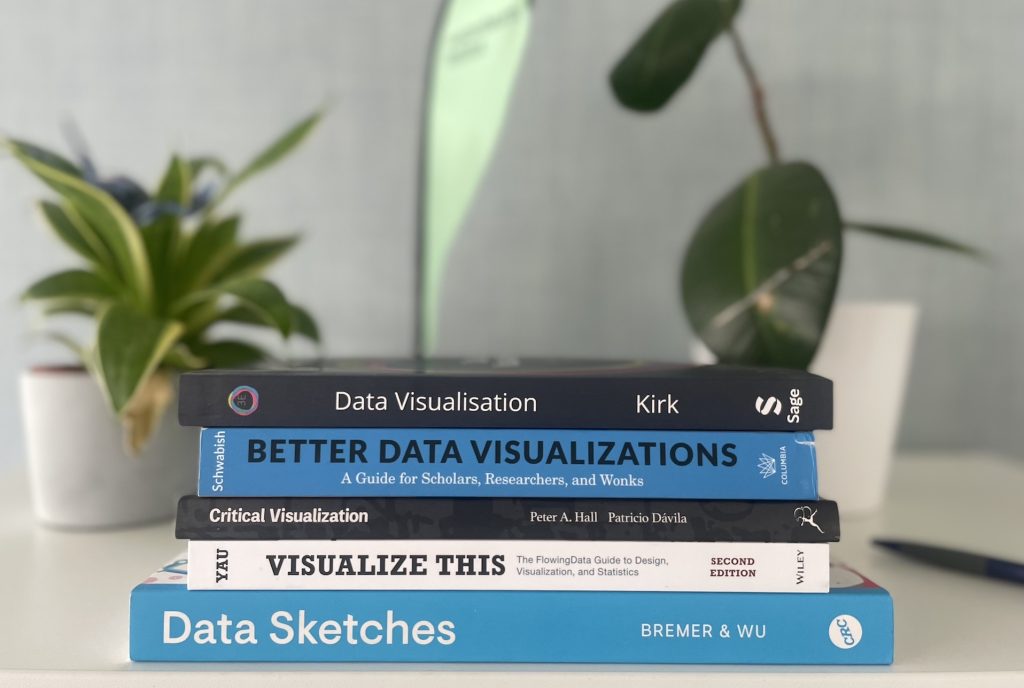
You may remember last year’s Methods lab survey assessing the institute’s methodological training needs, which found that 20% of participants requested additional support in data visualization and modeling. After the success of the scientific data visualization workshop led by Dr. Ansgar Hudde in winter 2025, the Methods Lab would like to provide ongoing support until the next workshop, with a curated collection of comprehensive data visualization books. The following books are now available in person at the WI on-site library! Read further to find more books, freely accessible online.

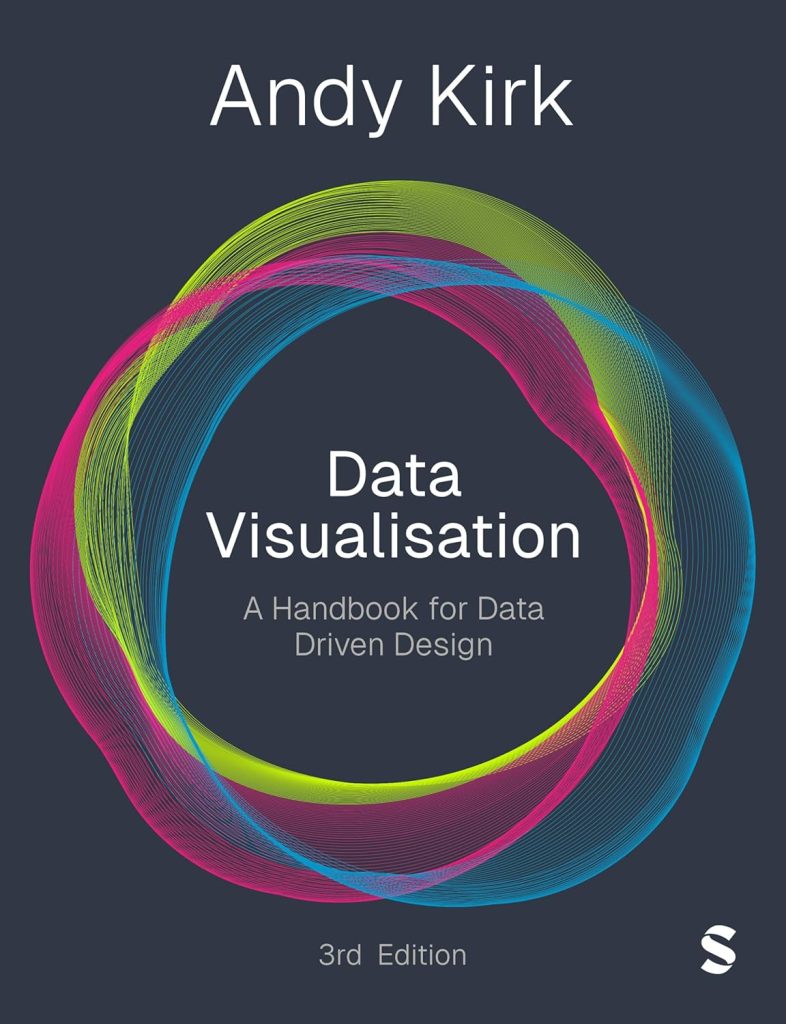
Data Visualisation: A Handbook for Data Driven Design (3rd Edition)
by data visualization expert, Andy Kirk

This book includes more than 200 examples showcasing data visualization in a broad range of fields. At the same time it combines critical, conceptual, theoretical, and practical thinking to help developing deeper insights.

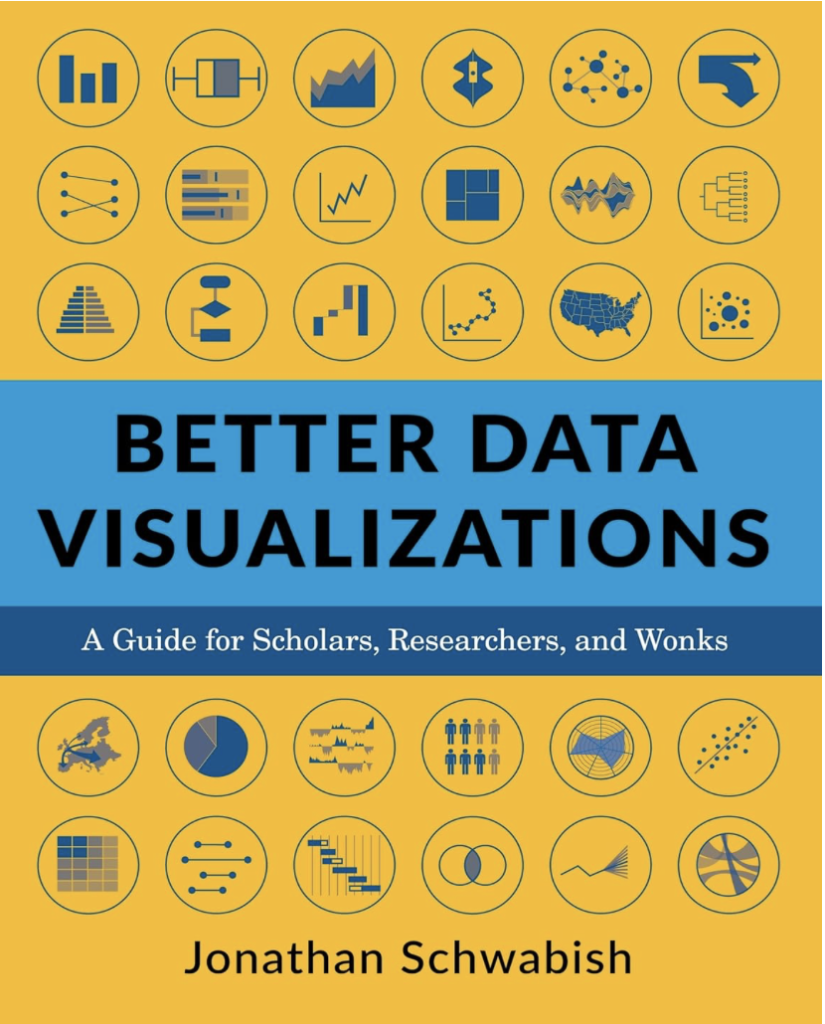
Better Data Visualizations: A Guide for Scholars, Researchers, and Wonks
by data visualization expert and economist, Jonathan Schwabish

This book includes over 500 data visualization examples and teaches how to design clear, engaging visualizations via practical techniques, visual principles, and a large array of chart types to better communicate information.

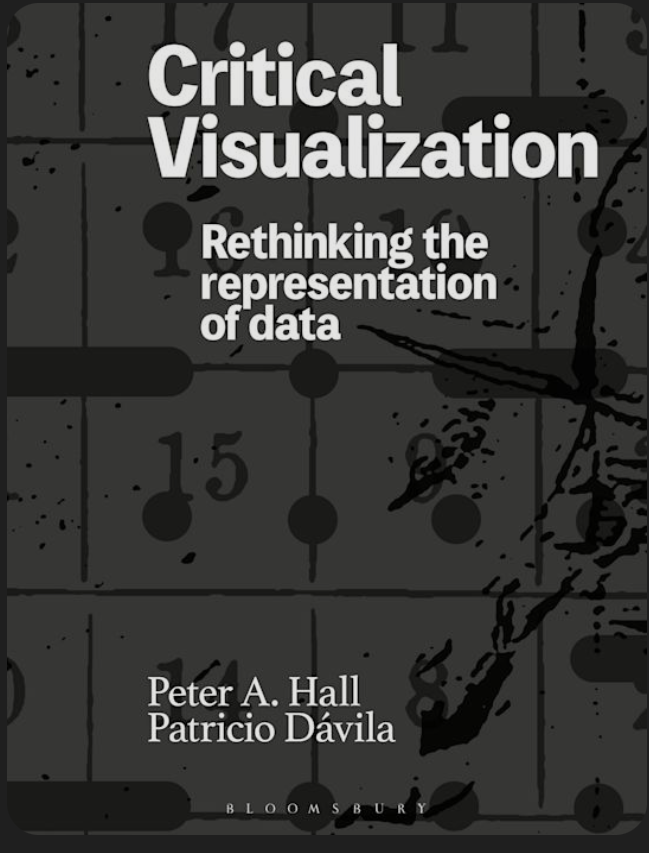
Critical Visualization: Rethinking the Representation of Data
by researchers, Peter A. Hall and Patricio Dávila

This book discusses how data visualization is never neutral, tracing its historical, cultural, and political roles while including critical, inclusive, and participatory ways of representing information.

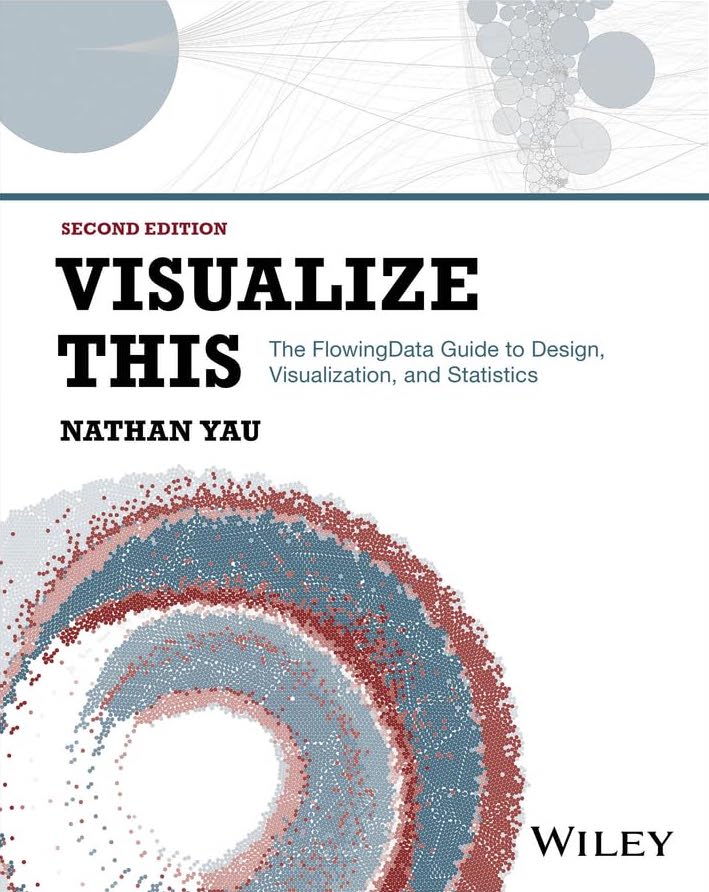
Visualize This: The FlowingData Guide to Design, Visualization and Statistics (2nd Edition)
by statistician, Nathan Yau

This full-color book offers a step-by-step guide to visualizing and storytelling with data, combining tool and programming examples, statistical analysis, and design to create clear and meaningful graphics.

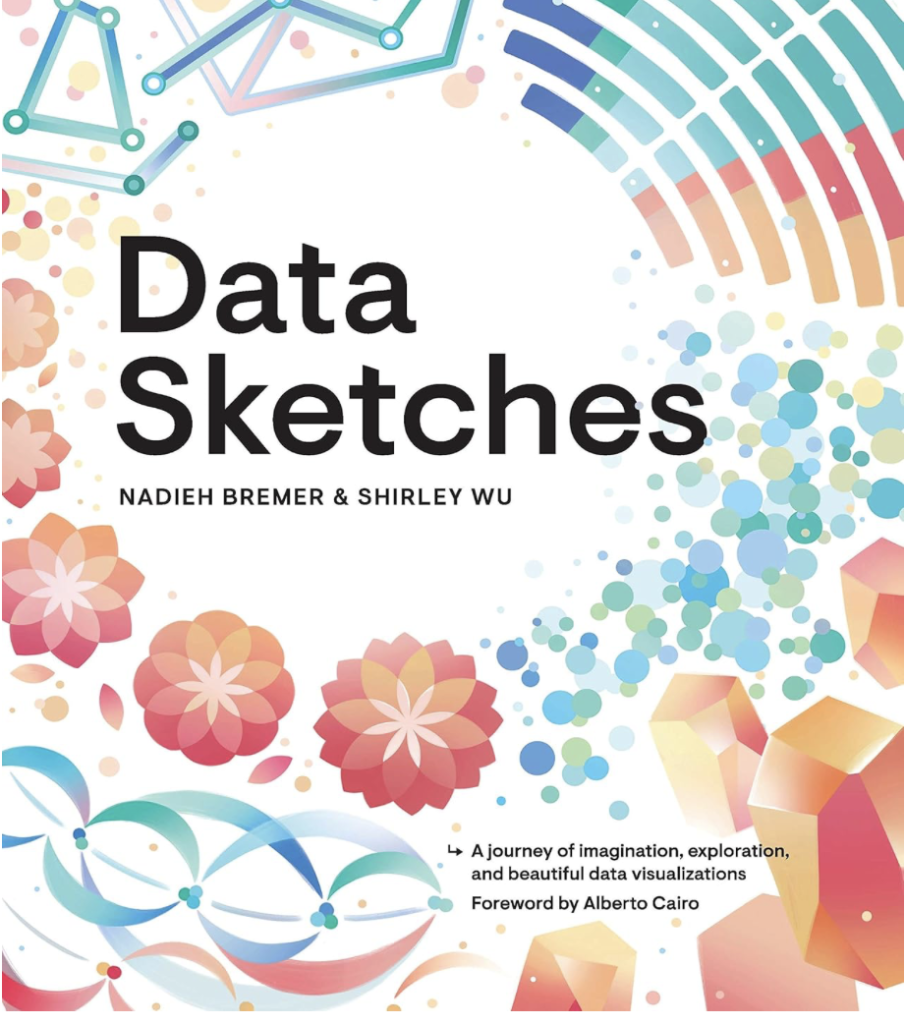
Data Sketches: A journey of imagination, exploration, and beautiful data visualizations
by data scientist, Nadieh Bremer, and data visualization designer, Shirley Wu

Accessible to those at every level of expertise, Data Sketches documents the creative and technical process behind 24 innovative data visualizations, giving thorough examples for data collection, coding strategies, and methods of artistic storytelling.


On top of that, we have identified multiple books on data visualization that are freely accessible online. Please check them out, following the link in each title.

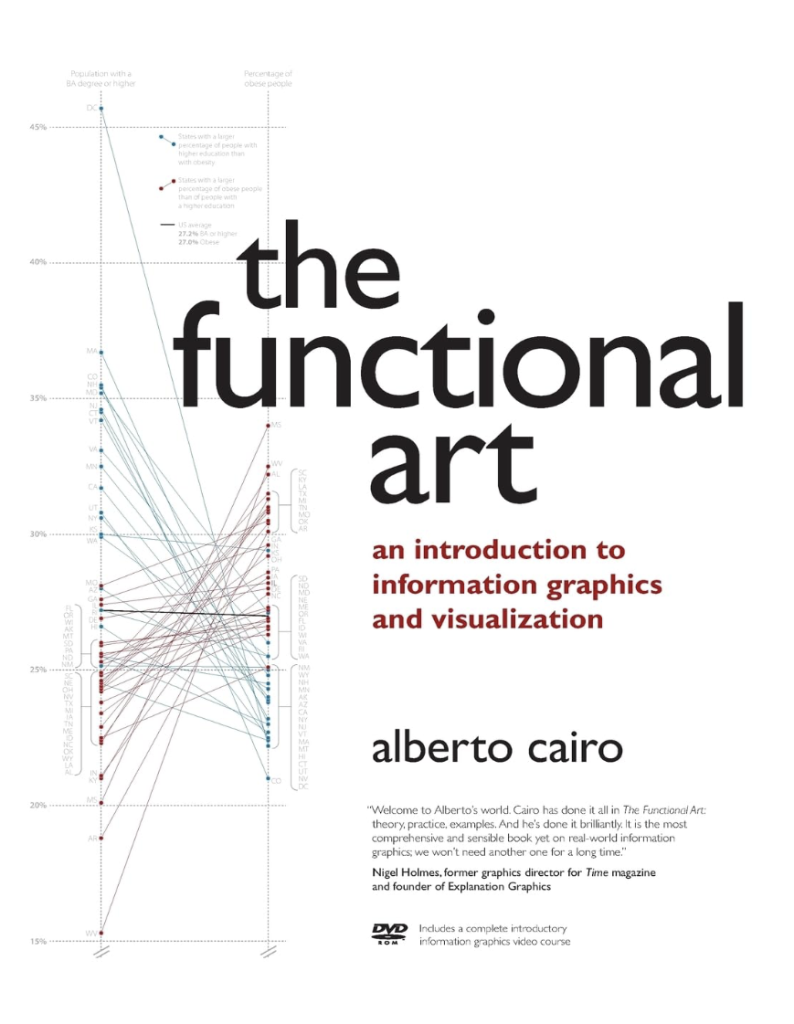
The Functional Art: An introduction to information graphics and visualization
by visualization designer, Alberto Cairo

This book reveals the artistic thought processes behind numerous leading designers and teaches how to transform raw data into well-defined, engaging graphics through analytical thinking, visual design, and storytelling.

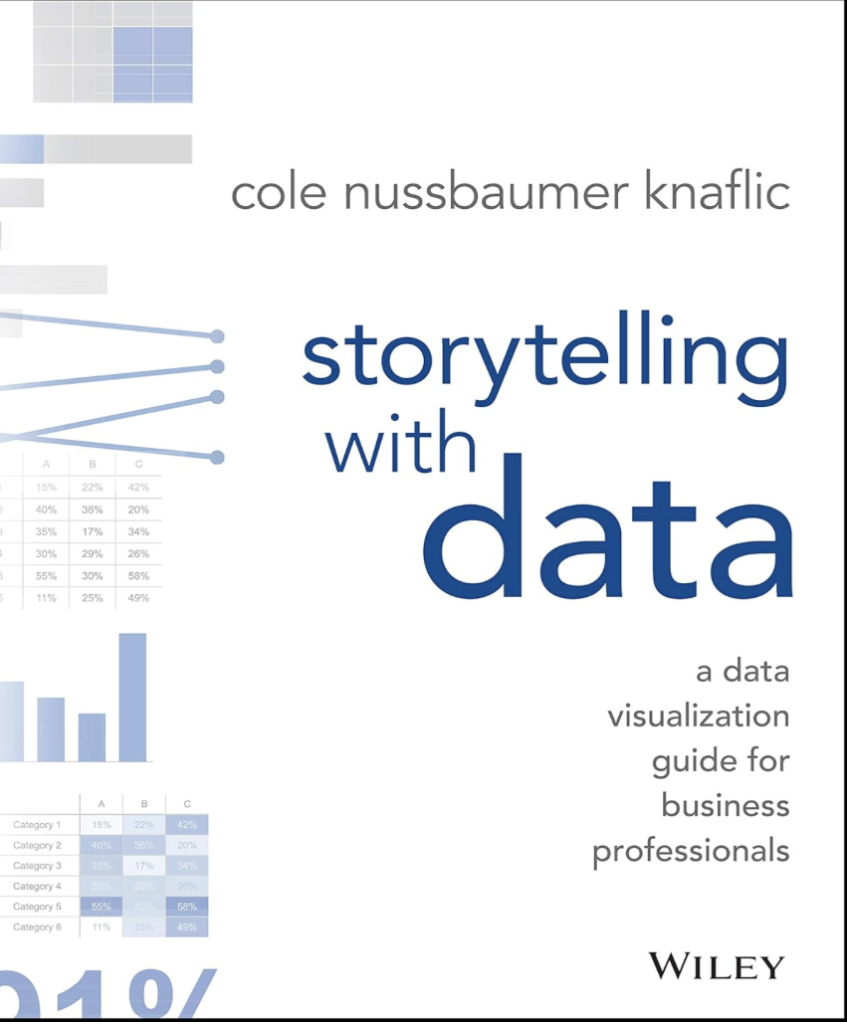
Storytelling With Data: A Data Visualization Guide for Business Professionals
by educator, Cole Nussbaumer Knaflic

This book shows how to turn data into clear, compelling visual stories by teaching effective graph selection, design principles, audience-focused communication, and storytelling techniques.

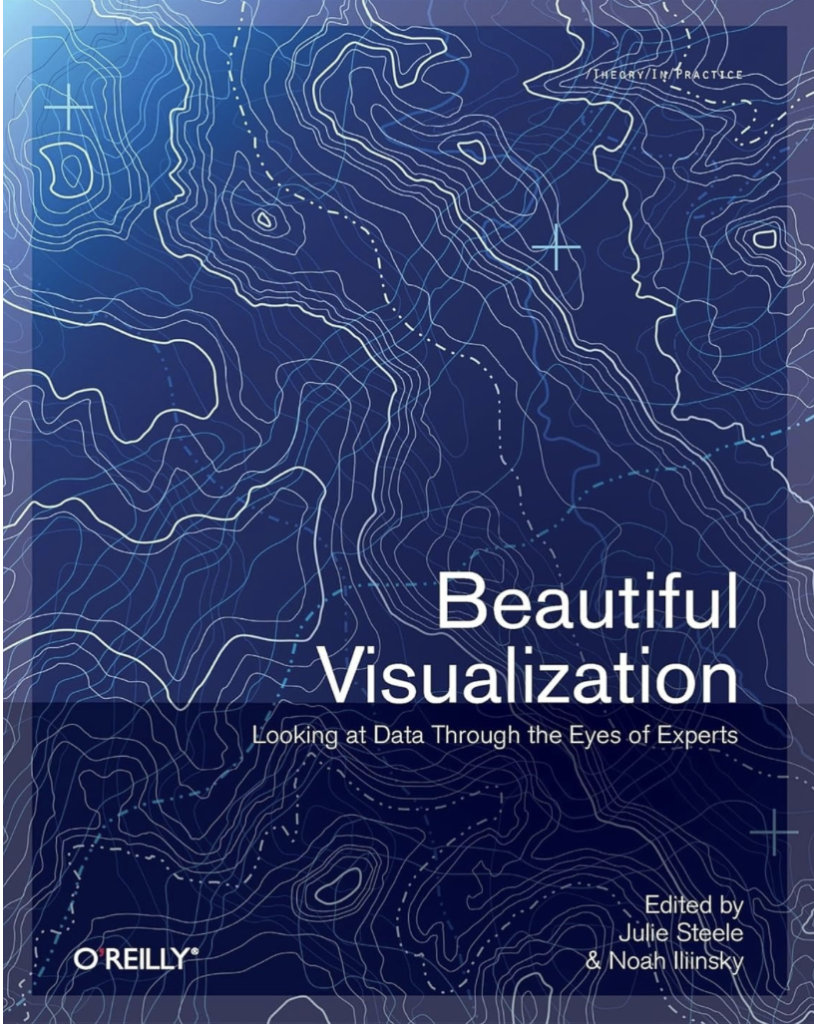
Beautiful Visualizations: Looking at Data Through the Eyes of Experts
by editor, Julie Steele, and information designer, Noah Linisky

This book demonstrates how visualization turns complex data, such as subway maps, brain diagrams, and personal habits into insightful graphics, revealing meaning through design, color, and storytelling techniques used by two dozen expert practitioners.

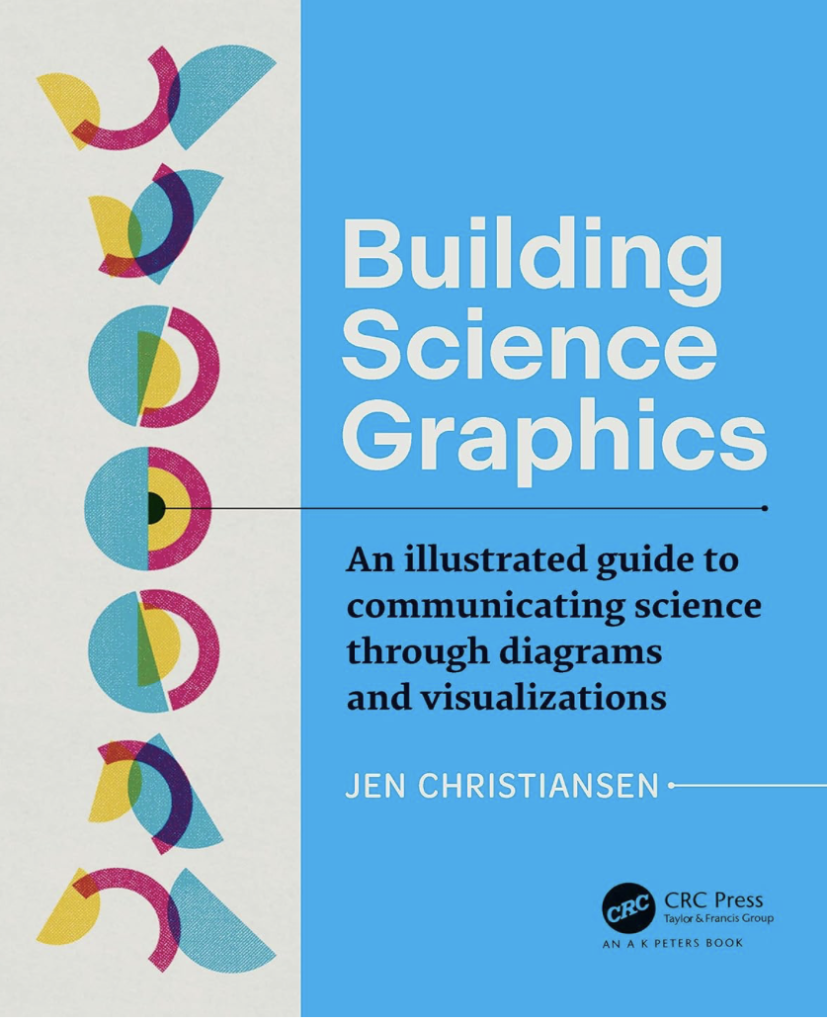
Building Science Graphics: An Illustrated Guide to Communicating Science through Diagrams and Visualizations
by senior graphics editor, Jen Christiansen 

This book provides a thorough and practical approach for creating science-focused explanatory diagrams, integrating evidence-based design strategies with worksheets to guide projects from concept to finished visualizations.

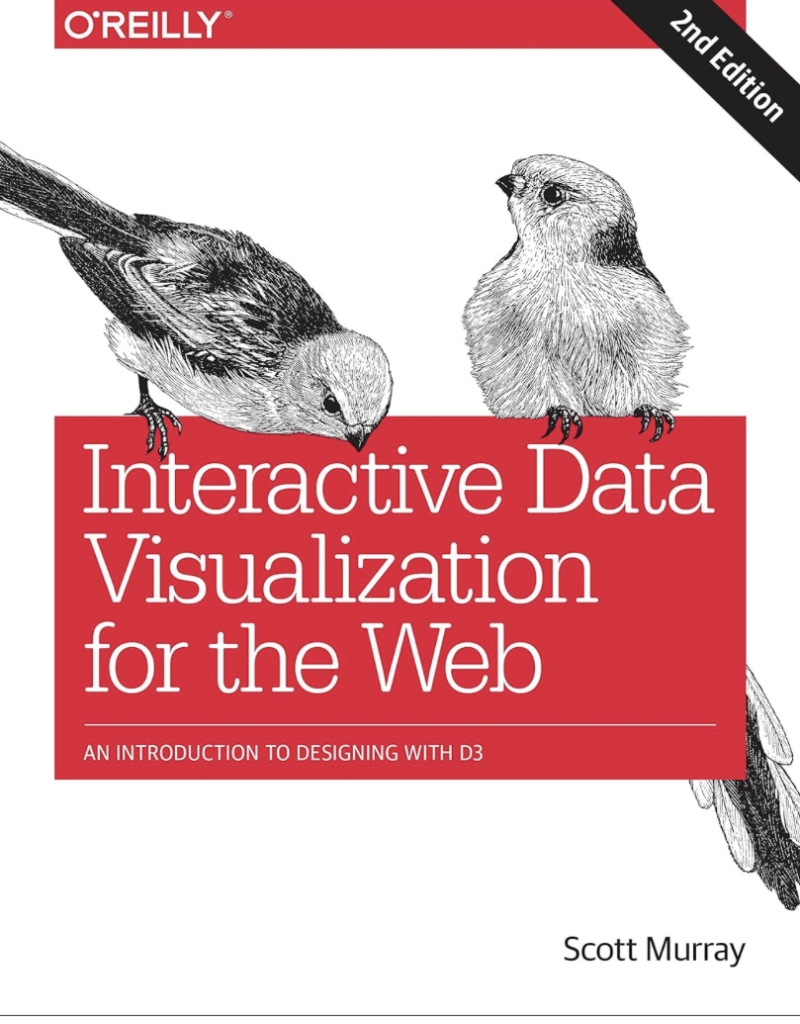
Interactive Data Visualization for the Web
by data visualization designer, Scott Murray

This text teaches readers, regardless of coding experience, how to build interactive, web-based data visualizations using D3, HTML, CSS, and JavaScript, with step-by-step examples, animations, maps, and real-world case studies.

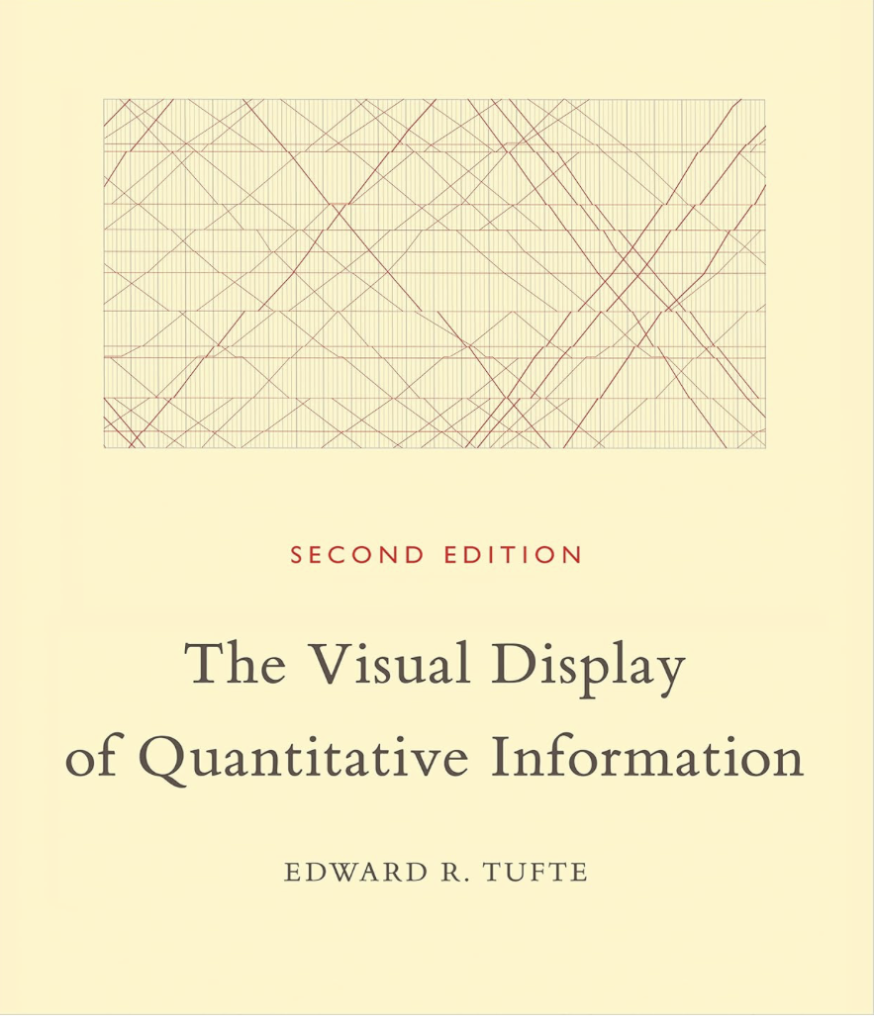
The Visual Display of Quantitative Information
by educator, Edward R. Tufte

With over 250 illustrations of statistical graphics, this book gives detailed guidance on presenting complex information through maps, charts, tables, multivariate designs, small multiples, and high-resolution displays, emphasizing clarity, precision, effective analysis, and the avoidance of graphical deception.

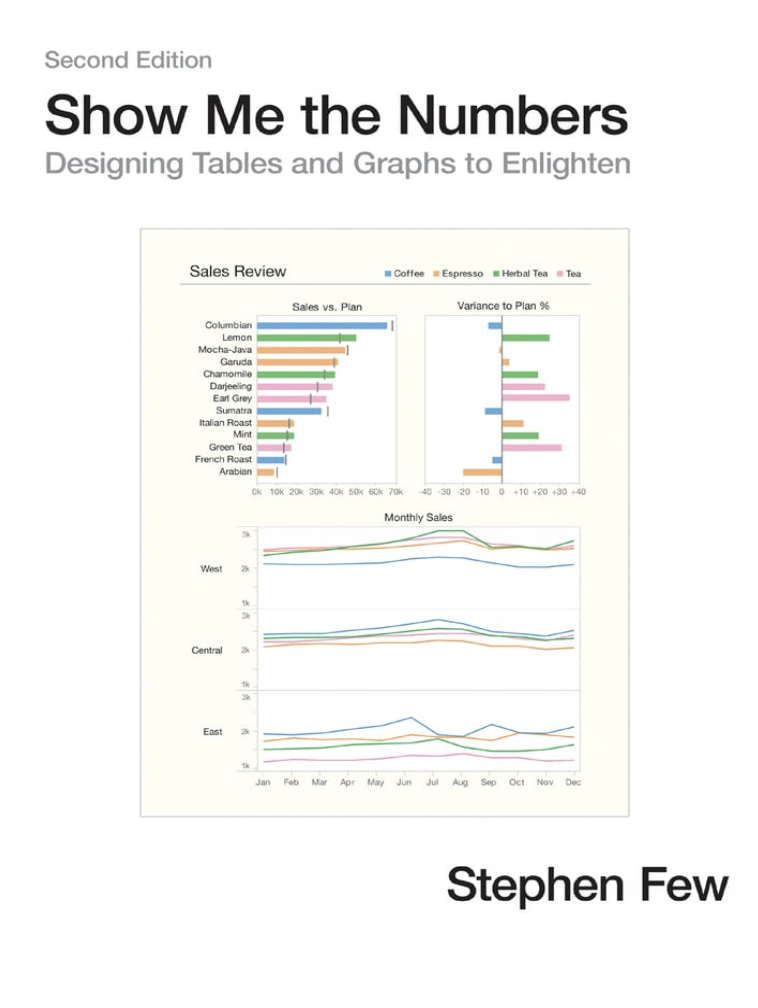
Show Me the Numbers: Designing Tables and Graphs to Enlighten
by data visualization expert, Stephen Few

This comprehensive guide shows how to design precise, informative charts and tables, with updated content on quantitative narrative, misuse of donut, circle, unit, and funnel charts, plus instructions for table lens displays, box plots in Excel, and effective color palettes.

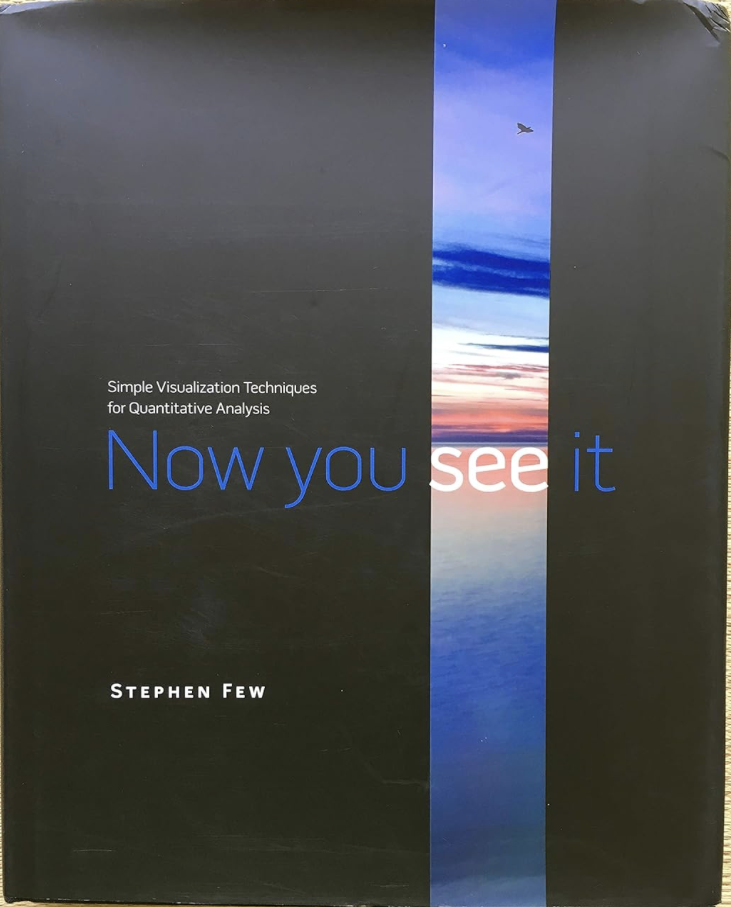
Now You See It: Simple Visualization Techniques for Quantitative Analysis
by data visualization expert, Stephen Few

This book serves as a companion to Show Me the Numbers, teaching readers to analyze quantitative data through example-based “thinking with our eyes,” using techniques applicable to several data analysis tools, revealing patterns, trends, relationships, and exceptions.

Workshop Recap: Introduction to Content Management System Open Paper

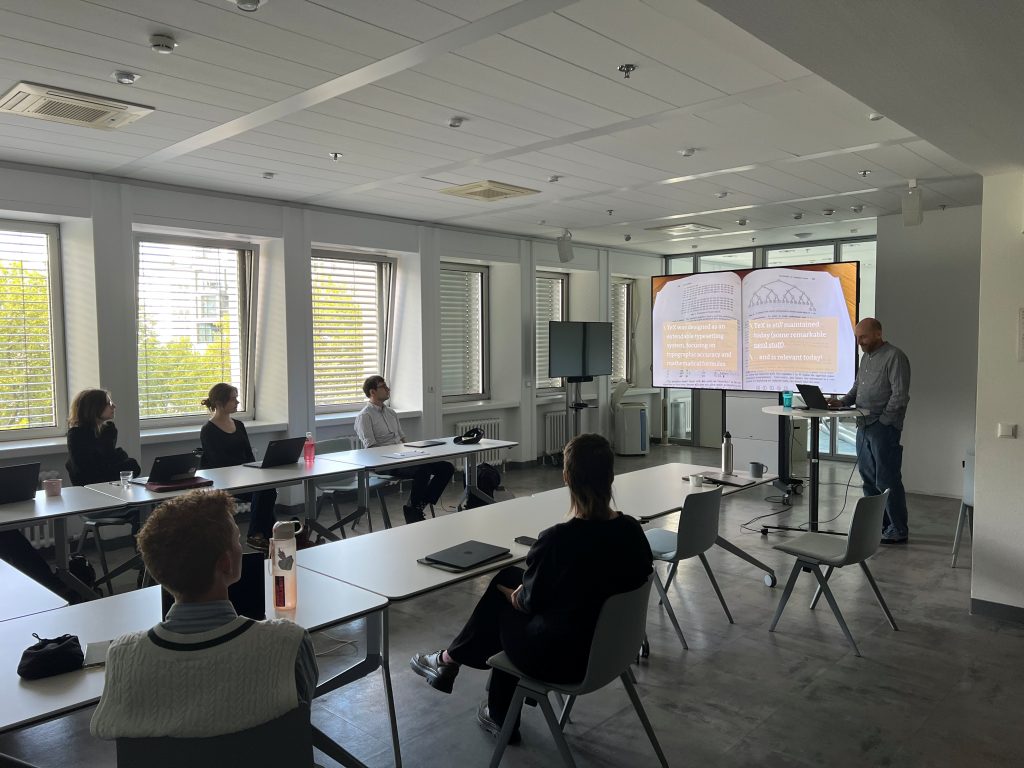
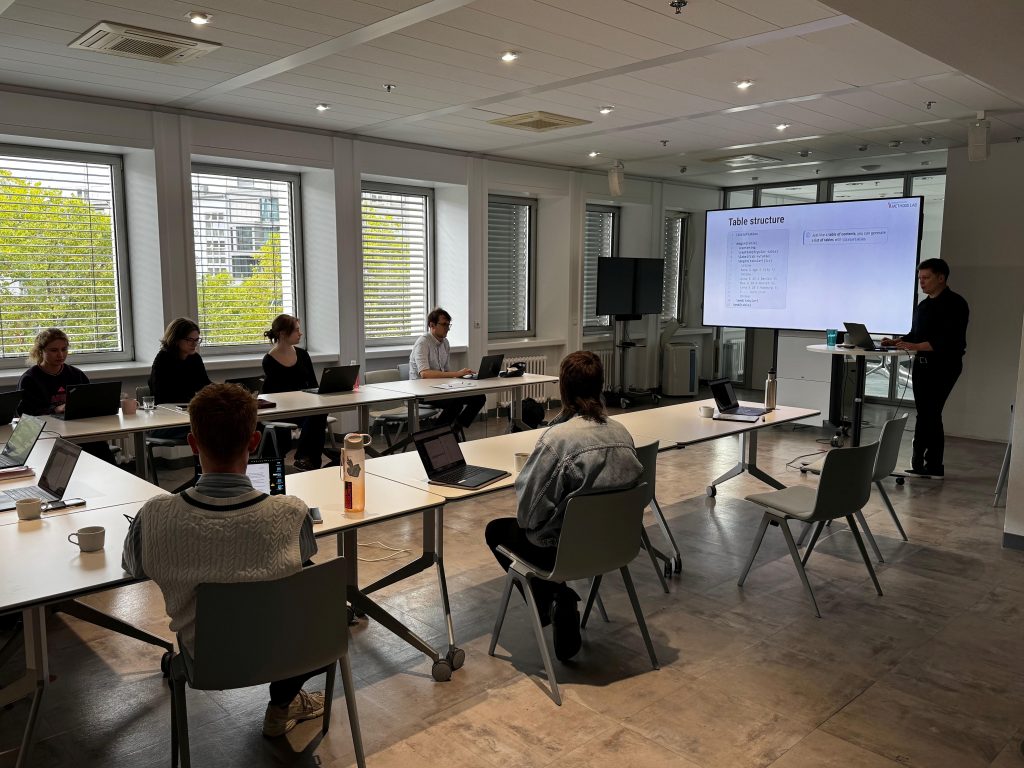
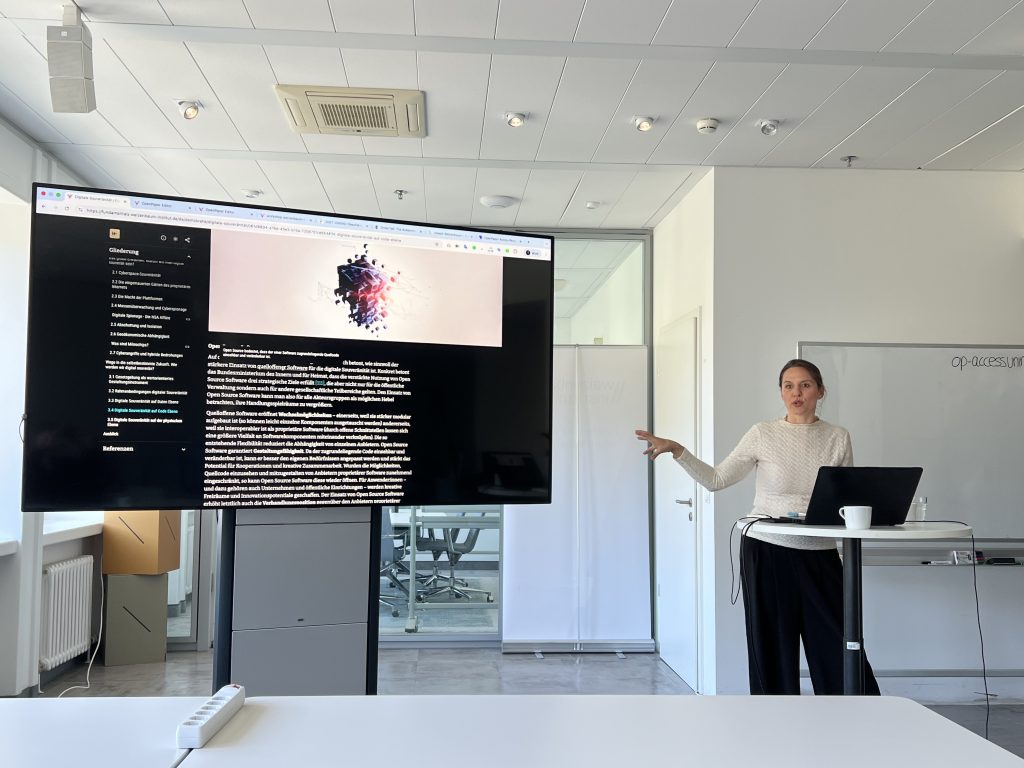
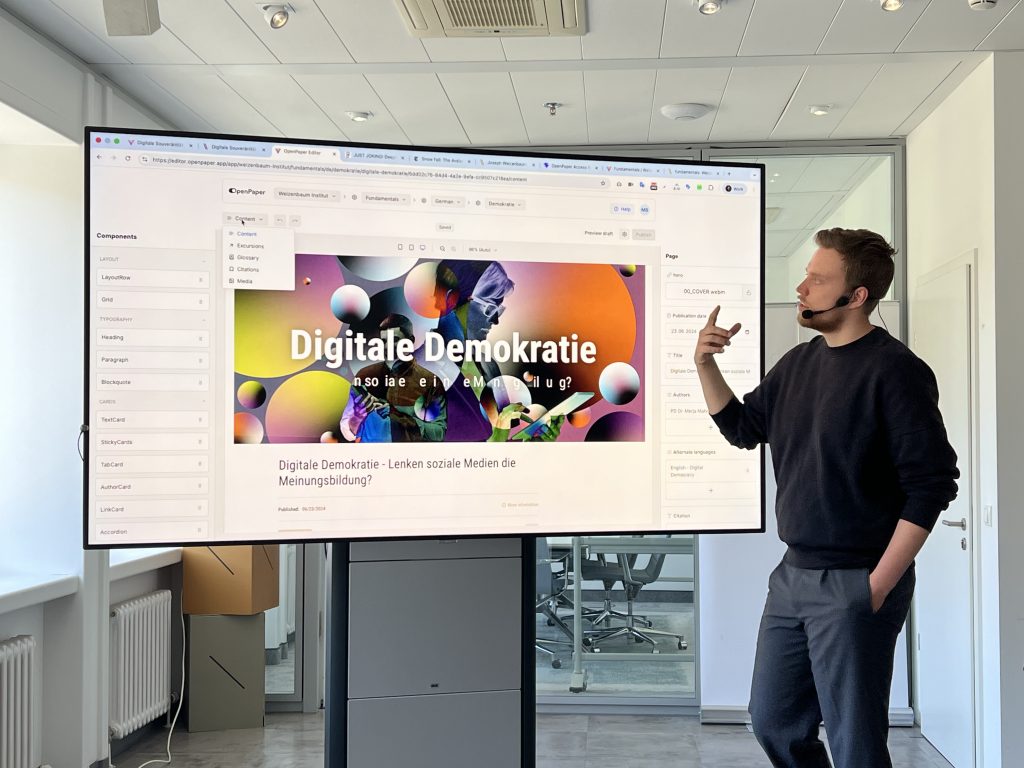
On April 28, 2026, researchers from the WI gathered for an engaging workshop introducing Open Paper – a next-generation content management system designed to break free from the constraints of traditional publishing formats. The session centered on a core idea: knowledge shouldn’t be confined to linear, static documents. Instead, Open Paper enables dynamic, interactive publications that adapt to how readers actually engage with content. By replacing rigid PDFs and blog posts with modular, navigable experiences, the platform empowers authors to create richer, more intuitive reading experiences. The workshop was organized by Merja Mahrt and Esther Görnemann from WI together with the Methods Lab, and Markus Brandenburg and Fabian Hassel from the agency that has developed Open PaperMADEFUL – were invited as speakers.

In the workshop, participants explored how Open Paper transforms static text into living publications. Through a hands-on demo, they discovered features like:

  • Modular content blocks (text, multimedia, citations, sticky notes, animations)
  • Flexible layouts with multi-column arrangements and responsive design
  • Interactive expositions that allow readers to dive deeper into subtopics while maintaining context
  • Self-contained chapters that make content accessible even when read out of order

The real impact was seen in an overview over digital sovereignty as part of the Weizenbaum fundamental series – a flagship example of what’s possible. With interactive visuals, side-by-side comparisons, and layered explanations, the publication achieved an average reader engagement of 26 minutes, which is a clear indicator of depth and interest. Even more telling: traffic increasingly comes from AI tools like ChatGPT, signaling that the content is not only readable but reusable and referable in emerging digital workflows.

Beyond design, Open Paper was built on strong ethical and technical foundations: open source, open access, GDPR-compliant, CO₂-neutral hosting, SEO-friendly, and fully accessible. Like the Weizenbaum Institute, other institutions can also deploy a custom instance aligned with their corporate design, ensuring brand consistency and long-term ownership.

The workshop’s interactive phase let participants discover how to build a page in real time using a three-panel interface:

  • Left: Structure and layout tools (grid, headings, visual elements)
  • Center: Live preview of content and layout
  • Right: Contextual editing options for the selected element

Beyond the workshop itself, the presenters further created a tutorial video made available on the WI’s Open Paper instance.

Rather than offering a one-size-fits-all template, Open Paper encourages authors to think critically about audience, structure, and engagement. It represents a shift in how we think about knowledge sharing: interactive, inclusive, and built for the future.

Conference Recap: “Data, Archive & Tool Demos” at DGPUK 2026

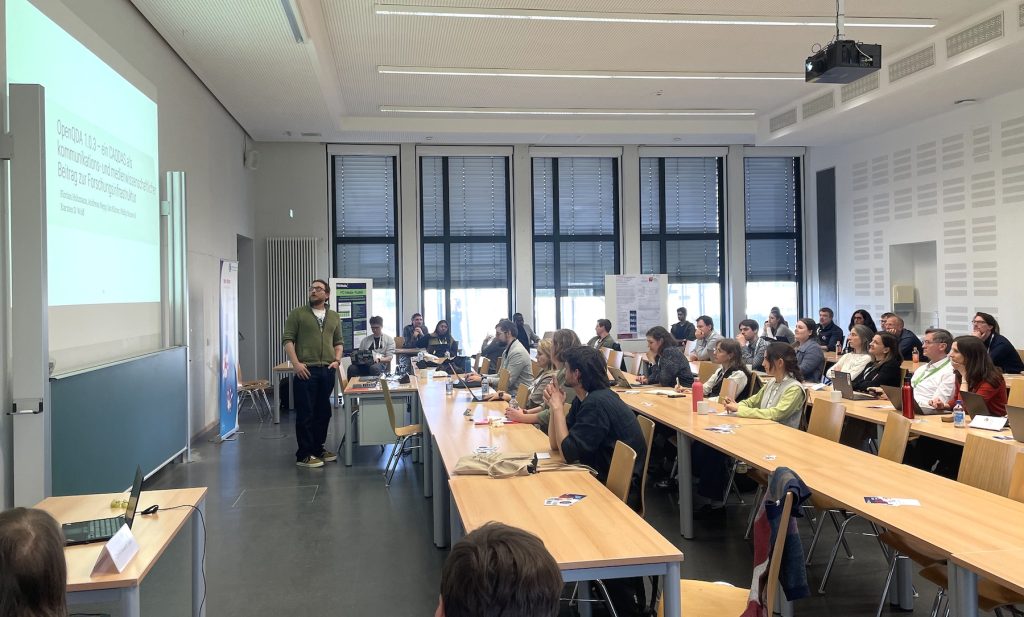
On March 19, 2026, the “Data, Archive & Tool Demos” panel returned at the annual conference of the German Communication Association (DGPuK) in Dortmund. Co-hosted by the Methods Lab lead Christian Strippel, colleagues and the GESIS Methods Hub, the panel brought together researchers to present and exchange reusable research data sets, archives, collections, and research software that promote transparency, collaboration, and methodological innovation in communication and media studies.

A total of 12 projects were presented, including the Platform Governance Archive, OpenQDA, the GESIS Pretest Database, the German Scandal Database, FID Media Publish, and a community data trustee for researching the far right online. The projects were first introduced in short presentations. Afterwards, interested colleagues from the audience could learn more about each project at poster and demo stations. As was the case two years prior, interest in the format was very high. This motivates us to continue offering this format in the future.

Introducing Overleaf at WI

Writing is at the core of scientific work: papers, research proposals, reports, and reviews are some of the most important elements of scientists’ everyday tasks. Although the act of writing is a complex subject itself, the tools that enable it are manifold and affect the efficiency of any research project.

Google Docs has established itself as a helpful tool for scientific writing over the past years. It is reminiscent of the well-known Microsoft Word, and is easy-to-use and convenient. As a web service, it does not require installing dedicated software, but works in any modern browser. Its main feature is collaborative writing – documents can be shared either via email address or a link, and edited together in real time, also allowing to post comments and track changes.

At the same time, LaTeX has grown in popularity as an alternative typesetting system and markup language for scientific and technical writing. As opposed to software like Microsoft Word and Google Docs, it distinguishes between the source of a text document which consists of the content as well as formatting instructions, and the rendered document (e.g., in .pdf format) which presents the formatted content accordingly. This separation between source and result enables more precision, since content as well as formatting are both provided in plain text, without applying the formatting right away. There are different LaTeX editors, such as TeXstudio or TeXMaker, that allow to create and edit documents. However, especially in reproducible research, LaTeX is popular for its compatibility with programming frameworks and libraries such as R Markdown, Quarto, Sweave, or PyLaTeX. These allow users to merge text and formatting with information in the programming environment (e.g., analysis results, tables, or figures) using placeholders that are automatically replaced with the current information whenever the document is rendered.

Overleaf is a tool for text editing using LaTeX, but featuring the advantages of Google Docs: It does not require installing separate software, as it is accessible through a web browser, and it enables collaborative writing. While Overleaf can be used on the official website either for free (with limited features) or with a subscription plan (to unlock more), it is also possible to host an instance locally.

To meet the growing demand at WI, avoid subscription costs, and have full control over stored and shared data, we hereby present the brand new Overleaf instance at the Weizenbaum Institute. It not only allows WI researchers, but also their external colleagues to work on text documents together in real time. Overleaf (Community Edition) is hosted by the IT department and administered by the Methods Lab, and it can be accessed at https://overleaf.weizenbaum-institut.de. To use it, an account is required, which can be requested from the Methods Lab. For further instructions, please consult the Overleaf page in the internal Wiki at WI.

Happy writing!

Reference: “When the Field is Online” Newsletter

When the Field Is Online is a monthly newsletter by Janet Salmons, PhD, qualitative methodologist, and author of 12 books in academic writing and research collaboration. Building on this extensive experience, Janet introduces thoughtful and creative strategies to overcome methodological challenges, and to connect meaningfully with others in an increasingly digital research landscape.

Her latest topics have reviewed virtual focus groups, ethics in remote research, reflexivity in data analysis, and tips for recruiting authentic voices. Each issue is unique, with a combination of original essays, thoughtful analysis, instructional videos, open access resources, and a bonus of her own self-drawn illustrations. The blog also links other relevant content and reflections on research obstacles from designing effective studies to asking stronger research questions. For anybody interested in expanding their qualitative research skills, strengthening digital communication, or discovering new ways to connect virtually, When the Field Is Online offers thorough guidance and novel ideas to inspire your work.

Most of this newsletter is freely available, but to access the full content, please sign up here to become a paid subscriber!

Computing Resources for WI

As digital methods advance rapidly, quantitative empirical research requires greater computing power. This includes complex statistical analyses, model training, and operating generative AI models. The necessary hardware is expensive and challenging to maintain, particularly at the institutional level (e.g., due to high temperatures in HPC clusters). Since not every institution can (or should) set up such hardware independently, resources are shared through collaborations with other institutions.

Against this background, the Weizenbaum Institute is exploring options to enable both low-demand computing tasks (e.g., a virtual machine for background web scraping) and high-demand tasks (e.g., running current large language models) for its researchers. Recently, the following options have been identified (some of which are only available to Berlin scientists):

Datenzentrum Berlin (Berlin University Alliance)

  • Not established yet, but planned

de.NBI Cloud (Deutsches Kompetenzzentrum Clouddienste)

  • free to use with scientific project proposal: https://datenkompetenz.cloud/
  • “Self service” virtual machines
  • currently trying to support digital humanities and social science

FUB-IT (Freie Universität Berlin)

  • Free to use (FU account required; guest accounts are available)
  • High-performance cluster (HPC)
  • Software partially included, some can be requested
  • GPUs are available

Gauss Computing Center

  • Up to very large scale projects (both HPC and AI) on proposal in different calls: https://www.gauss-centre.eu/for-users/hpc-access
  • Several equipment up to supercomputers SuperMUC I and II usable

Gesellschaft für wissenschaftliche Datenverarbeitung mbH Göttingen (GWDG):

Galaxy Server

  • Community-driven web-based analysis platform for life science research
  • Free to use batch system with many tools usable by browser, huge data sizes are no problem
  • Although coming from Bioinformatics, there are many tools for text processing, audio and image analyses, as well as statistics can be put together in pipelines.

HPI (Hasso Plattner Institut) UP Potsdam

Zentraleinrichtung Campusmanagement (TU Berlin)

  • Free to use (TUB account required)
  • High-performance cluster
  • Software partially included, some can be requested

Zuse Institute Berlin (ZIB)

  • Support from the state of Berlin, linked to BUA, e.g. BI-FOLD also calculates there
  • Provides tailor-made solutions, e.g. can make own instances of HAWKI, LibreChat or similar available with WI licenses
  • Resources available only by collaboration.

Apart from these external offers, the Weizenbaum Institute itself already provides some services to its researchers:

  • Virtual machines
  • Jupyterhub
  • Gitlab

Researchers who are interested in using any of these services can follow the instructions on the according websites for external services. For internal services, instructions are provided in the internal WI Wiki.

Disclaimer: This list will be updated regularly. If you know of any other resources that are available to members of the Weizenbaum Institute, please let us know.