Blog

Workshop: Prompting Ethnography: Experiments with LLMs in Fieldnotes, Analysis, Writing, and Reflexivity (29 October)

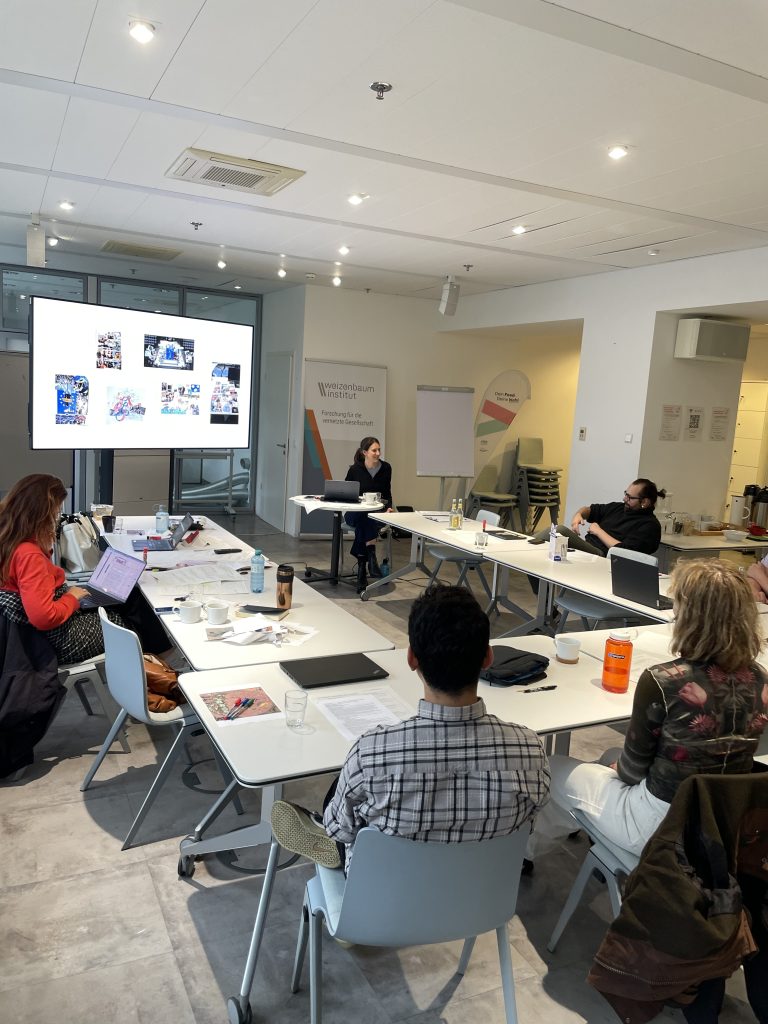
Join us for the workshop „Prompting Ethnography: Experiments with LLMs in Fieldnotes, Analysis, Writing, and Reflexivity“ for researchers and students with intermediate experience in ethnography who would like to explore and critically discuss the potential role of AI in ethnographic research. The workshop will take place on October 29, 2026 (10am–2pm) at the Weizenbaum Institute in the Flexroom (A1_04), and will be led by Prof. Dr. Paula Bialski (University of St. Gallen & WI) and Prof. Dr. Götz Bachmann (University of Siegen). This workshop is organized by the Weizenbaum PhD Network “Research in Practice”, coordinated by Katharina Berr and Jana Heim, and supported by the Weizenbaum Methods Lab.

What could AI offer in ethnographic research and where does it flatten, overinterpret, invent, or produce false coherence and what new forms of reflection become necessary and possible? In this experimental and hands-on workshop participants will work through  exercises involving scribbles, diary writing, analytical interpretation, essay drafting, and reflection. We will examine how LLMs can act as interlocutors, critics, and writing partners, sometimes through deliberately assigned roles, while also asking how researchers can retain responsibility for what is generated, revised, accepted, or rejected. The workshop is especially relevant for doctoral researchers, ethnographers, qualitative researchers, and teachers interested in AI and methodology. Participants are invited to bring short excerpts from their own scribbles, fieldnotes, or research memos, although sample material can also be provided.

The event is hybrid. It is open to QPD. To learn more, please visit our program page. We look forward to welcoming you!

Important Updates to The Open Science Framework (OSF)

Researchers may know the Open Science Framework (OSF) as a free, open-source infrastructure that has encouraged the organization, connection, and sharing of research outputs, including data, materials, code, registrations, and publications. It has also been a useful resource for storing, managing, and collaborating on files throughout one’s research process.

However, the Center for Open Science (COS) is making significant changes to the functionality of OSF. Moving forward, OSF will prioritize the preparation of study plans and preregistrations, as well as linking related data, materials, and code. It will also continue to support the sharing of preprints and papers. Nevertheless, due to funding limitations, OSF will no longer permit project and file management, private storage for newly added files, or the sharing of new data, materials, and code. Previously stored private projects will also be deleted, with users given 12 months’ advance notice.

Key deadlines

  • November 16, 2026: Creating new OSF Projects or child components will no longer be possible
  • February 19, 2027: Existing OSF Projects, links and DOI identifiers will still be accessible, but become read-only

Next steps for researchers

If your OSF project is still active or private, review whether its contents can be made public. If they need to remain private, consider moving them to another storage location. Move ongoing work to another appropriate repository or storage location. If you need somewhere to store future research outputs, use an appropriate repository for your data, materials, code, or other outputs, and link these outputs to OSF registrations or preprints where relevant.

How to choose an alternative data repository

Depending on your research needs, possible alternatives include Zenodo, GitHub, ResearchBox, Dataverse, and PsychArchives. Daniel Lakens gives a thorough comparison of these repositories in his blog post, which considers factors such as the type of research output, the properties offered by each platform, and the researcher’s technical skills. He also discusses the benefits and weaknesses of each software and how they may suit your specific research field and aim. 

The GESIS Leibniz Institute for Social Sciences also offers the archiving package BASIC which allows researchers to store, publish and reuse social science research data through their repository. 

BASIC services are free of charge and include: 

  • Backup of files for a minimum of 25 years (Bitstream Preservation)
  • BASIS entry check
  • DOI registration
  • Metadata form to provide additional information about your data
  • Publication and access to your data through the repository

For researchers at the Weizenbaum Institute

The Weizenbaum Library allows researchers to publish their research data or code under an open license. 

The Weizenbaum Cloud is a Nextcloud instance hosted by the Weizenbaum IT. It can be used to share project data internally or externally.

The Weizenbaum Institute also provides a self-hosted GitLab instance. It allows you to use a version control system for software projects, build CI/CD pipelines, and more. However, please note these projects cannot be shared outside the institute.

OSF transition resources

For more details on what these changes mean for your OSF content, see the OSF Projects transition help guide, and for further direction on how to select a new data repository, visit the OSF list of recommendations. 
Workshop recap: Introduction to LaTeX and Overleaf

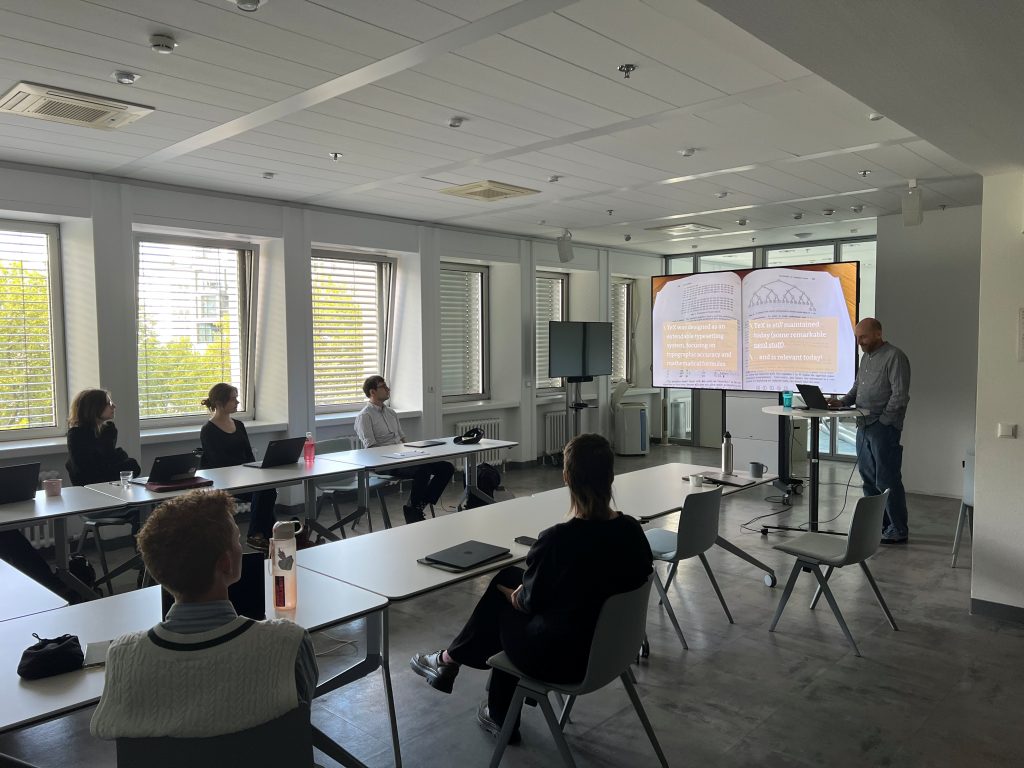
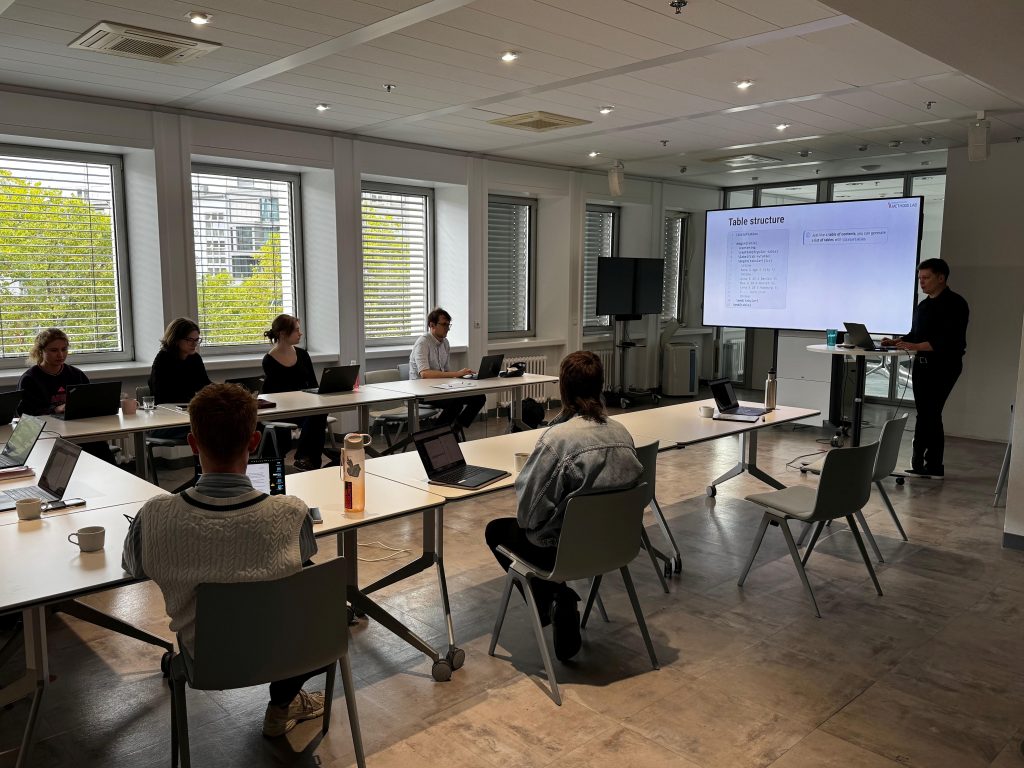
On September 10, 2026, Roland Toth (Methods Lab) and Jochen Knaus (Research Management) hosted the workshop Introduction to LaTeX and Overleaf at the Weizenbaum Institute. This hands-on session introduced participants to the fundamentals of LaTeX and the collaborative online platform Overleaf, equipping researchers with essential tools for precise, reproducible, and professional scientific writing.

In the first part, LaTeX’s origins were traced back to Donald E. Knuth’s 1978 creation of TeX, born from frustration with poor digital typesetting. Built on TeX, LaTeX separates content from formatting, letting authors focus on structure while the system handles layout – a principle still vital for academic writing, math-heavy documents, and long-form research. This part highlighted key advantages of LaTeX over traditional word processors like Microsoft Word or Google Docs:

  • Plain text source files ensure version control, reproducibility, and compatibility with modern data science workflows.
  • Automated PDF generation from source code allows seamless integration with tools like R Markdown, Quarto, Sweave, and PyLaTeX.
  • Robust support for citations and bibliographies via BibTeX and reference management tools (e.g., Zotero, Mendeley).
  • AI-friendly format: vast corpora of scientific literature in LaTeX are widely used to train generative AI models.

Participants were then introduced to Overleaf, the web-based LaTeX editor, which offers real-time collaboration, cloud storage, and a user-friendly interface – ideal for both beginners and experienced users. The Weizenbaum Institute’s own secure instance at https://overleaf.weizenbaum-institut.de was emphasized as a privacy-conscious alternative to the public version, which can also be used to collaborate with multiple people without requiring licenses. The core of the workshop was a hands-on exploration of LaTeX syntax and document structure. Throughout the session, participants were guided through practical exercises for each technique. Participants learned how to:

  • Set up a new project, manage files, and use the Overleaf interface
  • Structure documents and format text
  • Create structured content using sections, subsections, and subsubsections
  • Insert lists, tables, and figures with captions and labels
  • Cite literature systematically using .bib files
  • Troubleshooting common errors such as missing braces, undefined labels, and incorrect file paths.

In the final segment, participants were given an opportunity to convert the format of a sample paper using a journal template, which is a typical task in scientific writing and publishing.

Participants left with a working knowledge of LaTeX and Overleaf, and the confidence to begin writing their next paper, thesis, or proposal in a format ensuring precision, consistency, and long-term sustainability.

Workshop: Visualizing Situatedness – Situational Analysis through Maps and Collages (October 8, 2026)

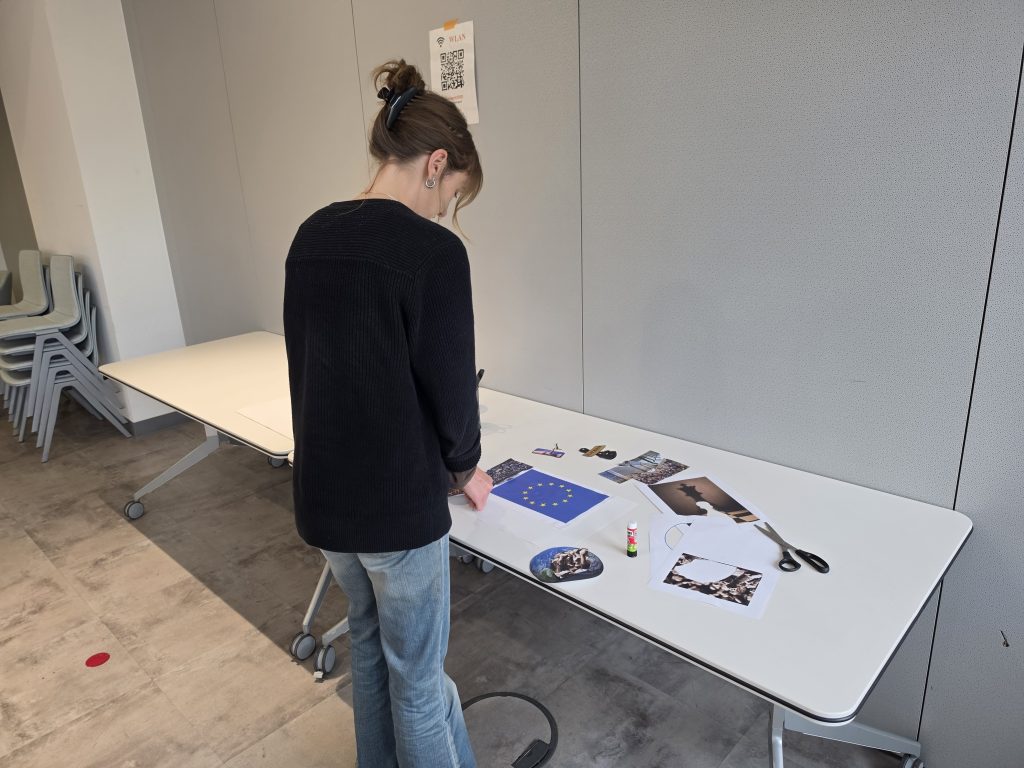
Join us for the workshop “Visualizing Situatedness – Situational Analysis through Maps and Collages” on October 8, 2026, where Franziska Zirker will introduce participants to Situational Analysis and collage-based mapping as tools for qualitative data analysis.

Qualitative research seeks to understand how people, technologies, institutions, discourses, and material environments become entangled in complex situations. Situational Analysis is an interpretative qualitative approach that helps researchers make these relational complexities visible through mapping.

This workshop introduces participants to the basics of Situational Analysis (e.g., creating situational maps from one’s own research material) and to an innovative collage-based extension of the method (e.g., translating maps into digitally sourced images and assembling them into physical collages). Participants will have the opportunity to apply what they have learned to their own research projects and to discuss how image selection, printing, cutting, and re-assembly shape analytical thinking.

The workshop is designed for researchers at any career stage and with any level of prior methodological experience; no prior knowledge is required, and research projects at any stage are welcome. Seats are limited to 15 participants. To learn more, please visit our program page. We look forward to welcoming you!

Workshop: Introduction to LaTeX and Overleaf (September 10, 2026)

Join us for the workshop Introduction to LaTeX and Overleaf on September 10, 2026, where Roland Toth and Jochen Knaus will introduce participants to the use of Latex through Overleaf for scientific and technical writing. This workshop is organized by the Methods Lab and Research Management at WI.

LaTeX is a typesetting system and markup language for scientific and technical writing with many advantages over Microsoft Word and similar software packages. Overleaf, which is hosted as a web service at the Weizenbaum Institute, enables collaborative writing projects using LaTeX. This workshop introduces participants to the basics of Overleaf (e.g., setting up an account, creating a project, collaboration, and file management) and to the fundamentals of LaTeX (e.g., formatting, packages, and citations). Participants will have the opportunity to apply what they have learned within a small project.

The workshop is designed for researchers (and student assistants) who have no/limited experience with LaTeX/Overleaf.

Seats are limited. To learn more, please visit our program page. We look forward to welcoming you!

Learn AI for Research with Instats

Interested in learning new research methods, building your programming skills, or exploring how AI can support your research? Instats is a global learning platform providing live and recorded training seminars in statistics, programming, research methods, and AI. Most seminars require a fee, but several sessions are also freely available after registration.

For example, many researchers have already benefitted from Peter Gruber’s presentations, such as AI Tools for Researchers 2.0. This fast-paced overview of AI tools supports every stage of the research process, from literature reviews and data analysis to academic writing. It also demonstrates how to make effective use of popular chatbots, specialized AI tools, and open-source models, showing what is convenient and what is worth paying for.

Those looking to explore more advanced applications may be interested in the workshops offered by Piers Steel and Hadi Fariborzi. Beyond ChatGPT: Agentic AI as 24/7 Research Assistants focuses on using agentic AI to automate research tasks such as data collection, analysis, and reporting for both qualitative and quantitative AI-driven methods, while Beyond ChatGPT: Using AI to Enhance Research Workflows covers ethical considerations when integrating AI tools into everyday research activities to improve the quality and efficiency of your work.

The platform also provides opportunities to network with hundreds of peers across institutions and disciplines, discover open research positions, and access additional professional development resources. Take a look!

The Methods Lab at the 76th Annual ICA Conference in Cape Town, South Africa

Over 4,000 communication scholars from around the world gathered in Cape Town, South Africa, from 4-8 June 2026 for the 76th Annual Conference of the International Communication Association (ICA). This years theme, “Communication and Inequalities in Context,” invited researchers to examine how communication structures reflect, reproduce, and respond to social inequalities, such as unequal access to information, digital divides and power dynamics that influence knowledge production in communication research.

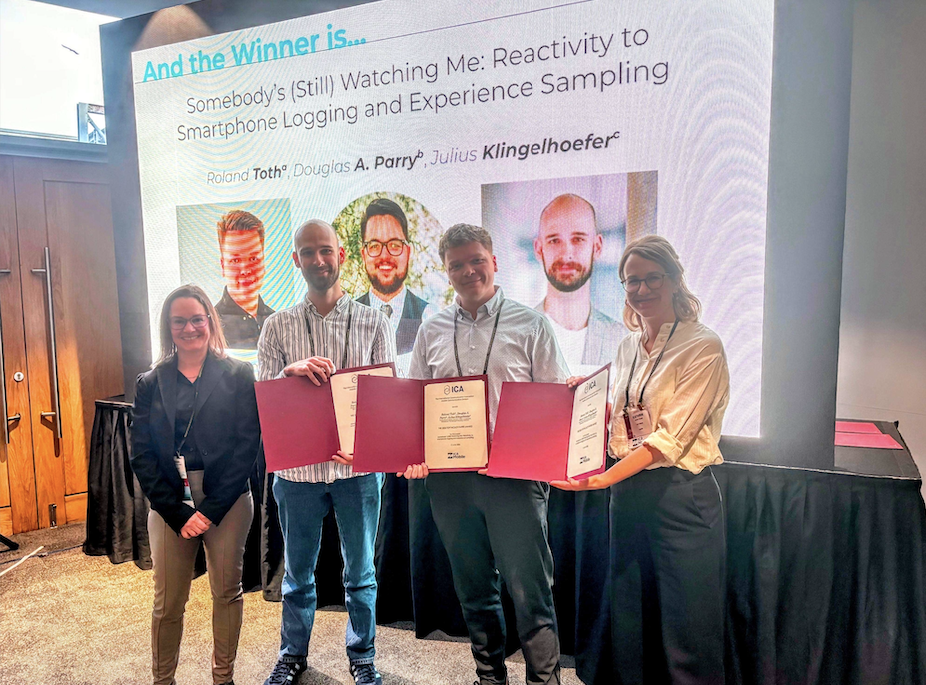
The Weizenbaum Institute was represented by several researchers who presented their work. A special congratulations goes to Roland Toth from the Methods Lab, who received the Mobile Communication Top Paper Award. His award-winning paper, co-authored with Douglas A. Parry (a Methods Lab research fellow) and Julius Kingelhoefer, examines reactivity effects resulting from providing access to Android event logs and participating in Mobile Experience Sampling studies, contributing to a better understanding of how research methods can influence participants’ smartphone use.

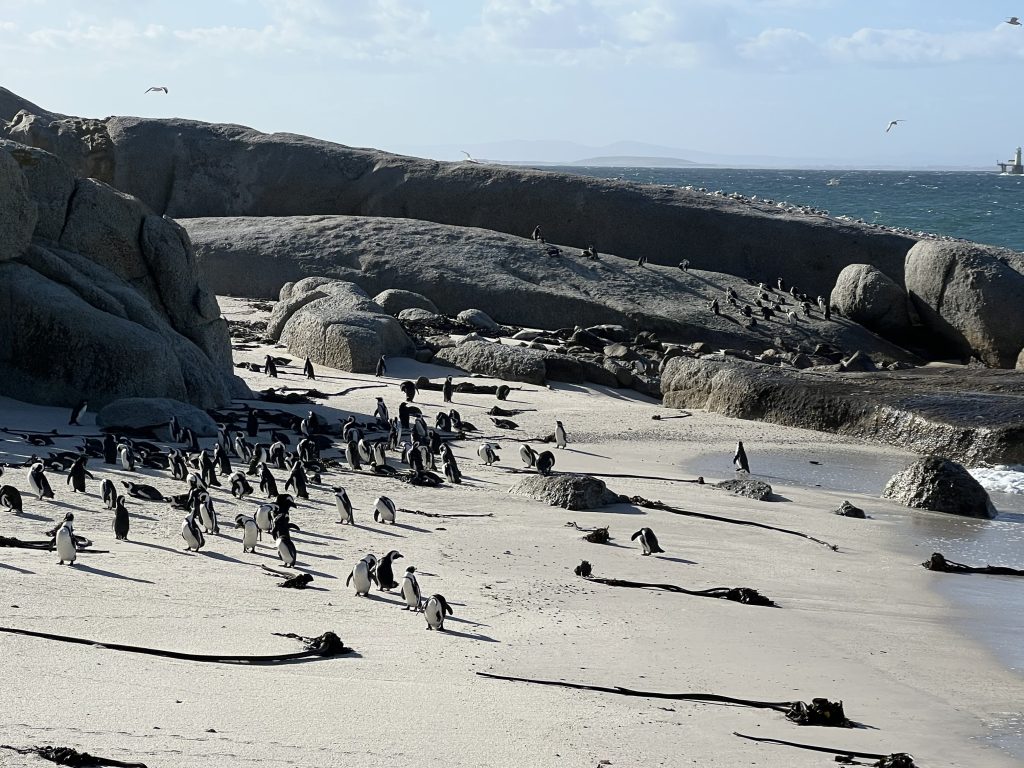
The award recognizes the international impact of Weizenbaum research and marks another successful ICA 2026 for the institute, where researchers also had the opportunity to encounter some of South Africa’s cutest wildlife (see the penguins pictured below).

OpenQDA now locally available at WI

We are pleased to announce the launch of a new local instance of OpenQDA, now accessible at https://openqda.intern.weizenbaum-institut.de/. This instance is hosted within the Weizenbaum Institute and provides researchers with a dedicated, secure environment for qualitative data analysis. As of now, LDAP authentication is not yet implemented, so access requires being on the Weizenbaum Institute network or connected via VPN. To create a new account, please access the link at the bottom of the landing page.

OpenQDA, developed by ZeMKI at the University of Bremen, is a free, open-source, web-based alternative to the commercial software MAXQDA. It supports core coding functions, follows the REFI standard for project interoperability, and enables collaborative workflows with versioning and shared codebooks. The platform also offers basic visualizations and is designed with GDPR-compliant data handling in mind.

This local instance builds on our earlier announcement of OpenQDA and reflects our commitment to open, collaborative, and ethically responsible research practices. The full source code is available on GitHub under the GNU Affero General Public License v3.0, and the ZeMKI welcomes feedback and contributions from the research community.

We encourage all researchers to explore the platform and help shape its development!

Open Research Europe: Open-Access Publishing Platform with Open Peer Review Starting Fall 2026

The crisis in academic publishing, along with its various sub-crises (the replication crisis, the procurement crisis, the AI-driven transformation of research, etc.), remains a topic of widespread debate. However, high article processing charges (APCs), oligopolistic publishing structures, and the dominance of reputation-based journals continue to shape scholarly publishing.

Fortunately, there has recently been a growing number of initiatives that go beyond merely diagnosing the problem and develop concrete solutions in the form of new infrastructure offerings. The ideal that many within the scientific community could agree on would be a resilient and decentralized publication infrastructure designed by scientists for scientists, one that takes into account the heterogeneity of the scientific landscape and disciplinary cultures while also providing financial relief. While the Chinese Academy of Sciences is taking initial action and deliberately ceasing to pay publication fees for certain international OA journals using academic funds and grants from the central government (thanks to Anne Krüger for this reference), a promising alternative is now emerging in Europe:

The open-access publishing platform Open Research Europe (ORE), which until now has been available only to beneficiaries of EU research framework programs, will be available free of charge starting this fall to all researchers working at German research institutions, regardless of whether they receive project funding. This is made possible by a consortium of research and funding organizations from eleven European countries, which will support the publishing platform starting this year. The contractual partner on the German side is the BMFTR, while the DFG is responsible for implementing the project at the national level.

For WI researchers, this will likely result in two concrete opportunities starting in the fall of 2026:

  1. Open-Access Publishing Free of Charge for All Disciplines
    ORE offers a free of charge alternative to the often prohibitive APCs charged by commercial publishers. Since the platform covers all academic disciplines, researchers in the social sciences, natural sciences, humanities, and beyond can publish their findings without financial barriers. This is particularly relevant given that the open-access transformation is still stalling in many areas. While some disciplines already rely heavily on preprint servers or Diamond OA journals, other fields still lack sustainable, non-commercial publication channels. ORE could fill this gap without the usual reputation mechanisms often tied to expensive journals.
    As the DFG emphasizes, with ORE, “academic prestige is not generated by the journal’s name, but by the scientific content of the individual publications and the assurance of high-quality processes at infrastructure level” (DFG, ifr-26-21). For researchers who wish to break free from the logic of impact factors, this likely offers an attractive opportunity to make high-quality research visible.

  1. Active Participation: Peer Review and Community Building
    ORE is not only a publishing platform but also a community-driven project. Researchers can get involved as reviewers: an opportunity to help shape the platform’s academic quality while showcasing their own expertise. Although, as with most publishers, peer review is most likely unpaid, the activity can be listed on an academic CV as a commitment to open science. Additionally, it offers networking opportunities with colleagues from various countries and disciplines. Those who get involved early on can, in the best-case scenario, actively help shape the development of a vital infrastructure for the future of scholarly publishing.

ORE could be an important step toward reforming the publishing system. It is therefore worth keeping an eye on its development and even getting involved early on.

Books on Data Visualization

You may remember last year’s Methods lab survey assessing the institute’s methodological training needs, which found that 20% of participants requested additional support in data visualization and modeling. After the success of the scientific data visualization workshop led by Dr. Ansgar Hudde in winter 2025, the Methods Lab would like to provide ongoing support until the next workshop, with a curated collection of comprehensive data visualization books. The following books are now available in person at the WI on-site library! Read further to find more books, freely accessible online.

Data Visualisation: A Handbook for Data Driven Design (3rd Edition)
by data visualization expert, Andy Kirk

This book includes more than 200 examples showcasing data visualization in a broad range of fields. At the same time it combines critical, conceptual, theoretical, and practical thinking to help developing deeper insights.

Better Data Visualizations: A Guide for Scholars, Researchers, and Wonks
by data visualization expert and economist, Jonathan Schwabish

This book includes over 500 data visualization examples and teaches how to design clear, engaging visualizations via practical techniques, visual principles, and a large array of chart types to better communicate information.

Critical Visualization: Rethinking the Representation of Data
by researchers, Peter A. Hall and Patricio Dávila

This book discusses how data visualization is never neutral, tracing its historical, cultural, and political roles while including critical, inclusive, and participatory ways of representing information.

Visualize This: The FlowingData Guide to Design, Visualization and Statistics (2nd Edition)
by statistician, Nathan Yau

This full-color book offers a step-by-step guide to visualizing and storytelling with data, combining tool and programming examples, statistical analysis, and design to create clear and meaningful graphics.

Data Sketches: A journey of imagination, exploration, and beautiful data visualizations
by data scientist, Nadieh Bremer, and data visualization designer, Shirley Wu

Accessible to those at every level of expertise, Data Sketches documents the creative and technical process behind 24 innovative data visualizations, giving thorough examples for data collection, coding strategies, and methods of artistic storytelling.


On top of that, we have identified multiple books on data visualization that are freely accessible online. Please check them out, following the link in each title.

The Functional Art: An introduction to information graphics and visualization
by visualization designer, Alberto Cairo

This book reveals the artistic thought processes behind numerous leading designers and teaches how to transform raw data into well-defined, engaging graphics through analytical thinking, visual design, and storytelling.

Storytelling With Data: A Data Visualization Guide for Business Professionals
by educator, Cole Nussbaumer Knaflic

This book shows how to turn data into clear, compelling visual stories by teaching effective graph selection, design principles, audience-focused communication, and storytelling techniques.

Beautiful Visualizations: Looking at Data Through the Eyes of Experts
by editor, Julie Steele, and information designer, Noah Linisky

This book demonstrates how visualization turns complex data, such as subway maps, brain diagrams, and personal habits into insightful graphics, revealing meaning through design, color, and storytelling techniques used by two dozen expert practitioners.

Building Science Graphics: An Illustrated Guide to Communicating Science through Diagrams and Visualizations
by senior graphics editor, Jen Christiansen 

This book provides a thorough and practical approach for creating science-focused explanatory diagrams, integrating evidence-based design strategies with worksheets to guide projects from concept to finished visualizations.

Interactive Data Visualization for the Web
by data visualization designer, Scott Murray

This text teaches readers, regardless of coding experience, how to build interactive, web-based data visualizations using D3, HTML, CSS, and JavaScript, with step-by-step examples, animations, maps, and real-world case studies.

The Visual Display of Quantitative Information
by educator, Edward R. Tufte

With over 250 illustrations of statistical graphics, this book gives detailed guidance on presenting complex information through maps, charts, tables, multivariate designs, small multiples, and high-resolution displays, emphasizing clarity, precision, effective analysis, and the avoidance of graphical deception.

Show Me the Numbers: Designing Tables and Graphs to Enlighten
by data visualization expert, Stephen Few

This comprehensive guide shows how to design precise, informative charts and tables, with updated content on quantitative narrative, misuse of donut, circle, unit, and funnel charts, plus instructions for table lens displays, box plots in Excel, and effective color palettes.

Now You See It: Simple Visualization Techniques for Quantitative Analysis
by data visualization expert, Stephen Few

This book serves as a companion to Show Me the Numbers, teaching readers to analyze quantitative data through example-based “thinking with our eyes,” using techniques applicable to several data analysis tools, revealing patterns, trends, relationships, and exceptions.