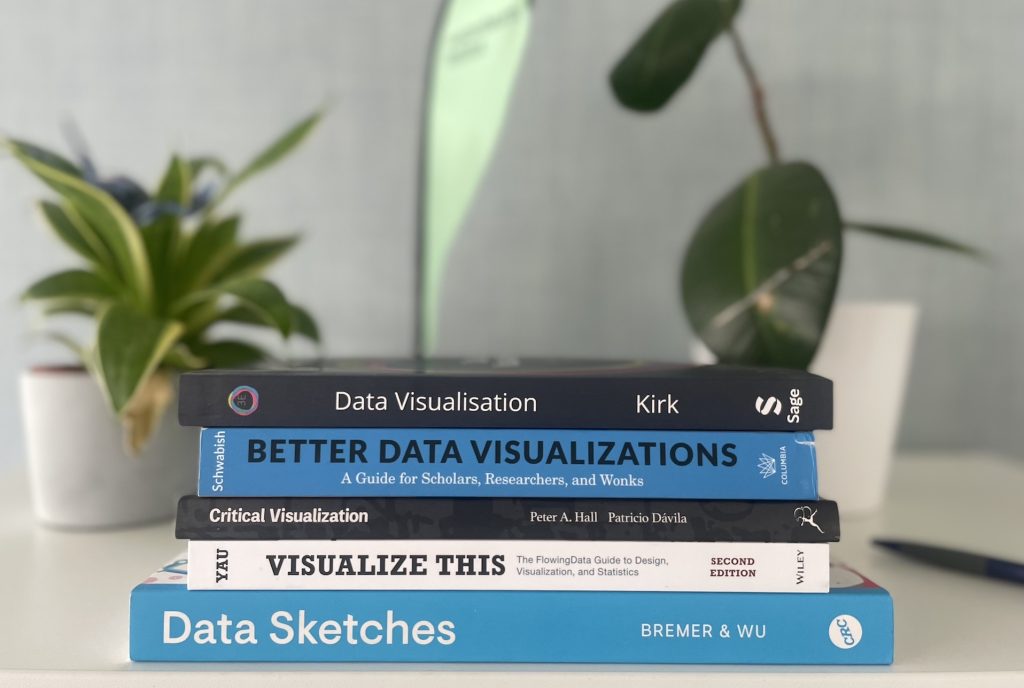
You may remember last year’s Methods lab survey assessing the institute’s methodological training needs, which found that 20% of participants requested additional support in data visualization and modeling. After the success of the scientific data visualization workshop led by Dr. Ansgar Hudde in winter 2025, the Methods Lab would like to provide ongoing support until the next workshop, with a curated collection of comprehensive data visualization books. The following books are now available in person at the WI on-site library! Read further to find more books, freely accessible online.
Data Visualisation: A Handbook for Data Driven Design (3rd Edition)
by data visualization expert, Andy Kirk
This book includes more than 200 examples showcasing data visualization in a broad range of fields. At the same time it combines critical, conceptual, theoretical, and practical thinking to help developing deeper insights.
Better Data Visualizations: A Guide for Scholars, Researchers, and Wonks
by data visualization expert and economist, Jonathan Schwabish
This book includes over 500 data visualization examples and teaches how to design clear, engaging visualizations via practical techniques, visual principles, and a large array of chart types to better communicate information.
Critical Visualization: Rethinking the Representation of Data
by researchers, Peter A. Hall and Patricio Dávila
This book discusses how data visualization is never neutral, tracing its historical, cultural, and political roles while including critical, inclusive, and participatory ways of representing information.
Visualize This: The FlowingData Guide to Design, Visualization and Statistics (2nd Edition)
by statistician, Nathan Yau
This full-color book offers a step-by-step guide to visualizing and storytelling with data, combining tool and programming examples, statistical analysis, and design to create clear and meaningful graphics.
Data Sketches: A journey of imagination, exploration, and beautiful data visualizations
by data scientist, Nadieh Bremer, and data visualization designer, Shirley Wu
Accessible to those at every level of expertise, Data Sketches documents the creative and technical process behind 24 innovative data visualizations, giving thorough examples for data collection, coding strategies, and methods of artistic storytelling.
On top of that, we have identified multiple books on data visualization that are freely accessible online. Please check them out, following the link in each title.
The Functional Art: An introduction to information graphics and visualization
by visualization designer, Alberto Cairo
This book reveals the artistic thought processes behind numerous leading designers and teaches how to transform raw data into well-defined, engaging graphics through analytical thinking, visual design, and storytelling.
Storytelling With Data: A Data Visualization Guide for Business Professionals
by educator, Cole Nussbaumer Knaflic
This book shows how to turn data into clear, compelling visual stories by teaching effective graph selection, design principles, audience-focused communication, and storytelling techniques.
Beautiful Visualizations: Looking at Data Through the Eyes of Experts
by editor, Julie Steele, and information designer, Noah Linisky
This book demonstrates how visualization turns complex data, such as subway maps, brain diagrams, and personal habits into insightful graphics, revealing meaning through design, color, and storytelling techniques used by two dozen expert practitioners.
Building Science Graphics: An Illustrated Guide to Communicating Science through Diagrams and Visualizations
by senior graphics editor, Jen Christiansen
This book provides a thorough and practical approach for creating science-focused explanatory diagrams, integrating evidence-based design strategies with worksheets to guide projects from concept to finished visualizations.
Interactive Data Visualization for the Web
by data visualization designer, Scott Murray
This text teaches readers, regardless of coding experience, how to build interactive, web-based data visualizations using D3, HTML, CSS, and JavaScript, with step-by-step examples, animations, maps, and real-world case studies.
The Visual Display of Quantitative Information
by educator, Edward R. Tufte
With over 250 illustrations of statistical graphics, this book gives detailed guidance on presenting complex information through maps, charts, tables, multivariate designs, small multiples, and high-resolution displays, emphasizing clarity, precision, effective analysis, and the avoidance of graphical deception.
Show Me the Numbers: Designing Tables and Graphs to Enlighten
by data visualization expert, Stephen Few
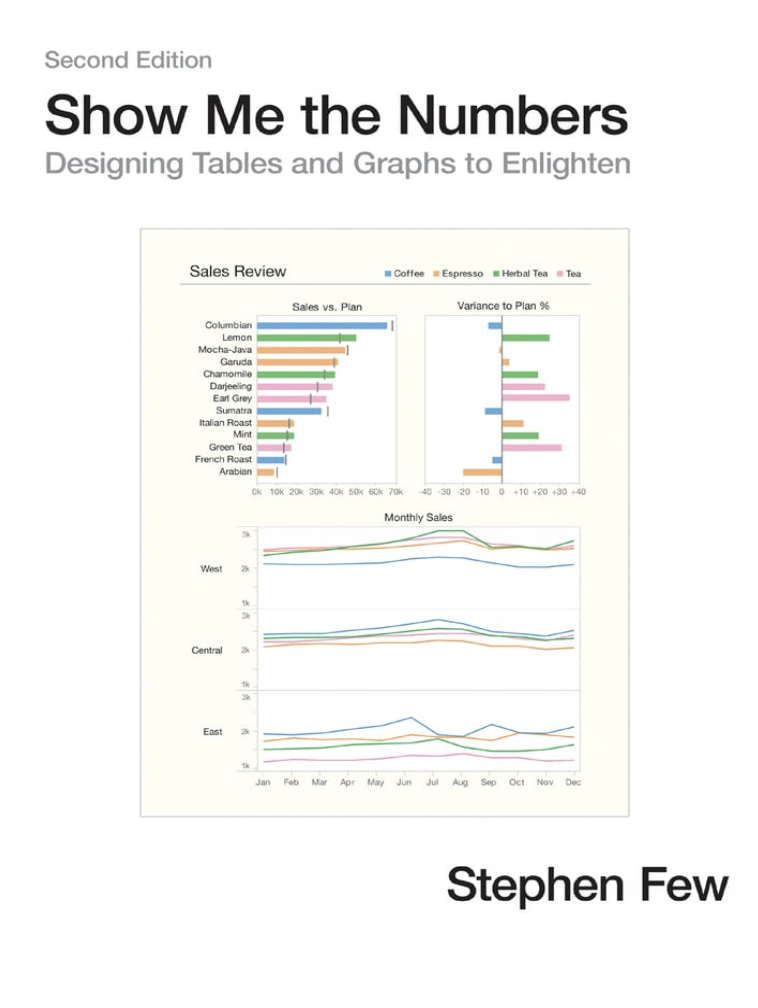
This comprehensive guide shows how to design precise, informative charts and tables, with updated content on quantitative narrative, misuse of donut, circle, unit, and funnel charts, plus instructions for table lens displays, box plots in Excel, and effective color palettes.
Now You See It: Simple Visualization Techniques for Quantitative Analysis
by data visualization expert, Stephen Few
This book serves as a companion to Show Me the Numbers, teaching readers to analyze quantitative data through example-based “thinking with our eyes,” using techniques applicable to several data analysis tools, revealing patterns, trends, relationships, and exceptions.