We are excited to announce the launch of the Weizenbaum Panel Data Explorer, an interactive website developed by Methods Lab member Roland Toth. The Data Explorer allows you to browse and analyze survey results from the annual survey conducted by the Weizenbaum Panel on media use, political participation, civic norms, and more. In the spirit of open science, it not only presents research data, but also in an easy-to-use manner.
The Weizenbaum Panel aims to shed light on the complex relationship between the digital realm and political engagement. By examining phenomena such as hate speech and fake news, as well as the active commitment to a democratic culture of debate, the telephone survey offers invaluable insights into the ever-evolving dynamics of citizen participation in Germany.
With the launch of Data Explorer, you can explore this comprehensive dataset and gain a deeper understanding of Germany’s social and political landscape. The platform offers six categories: social media platform use, political attitudes, civic norms, political participation, and online civic intervention. Each category presents a unique perspective, allowing you to examine specific aspects of Germany’s social and political fabric.
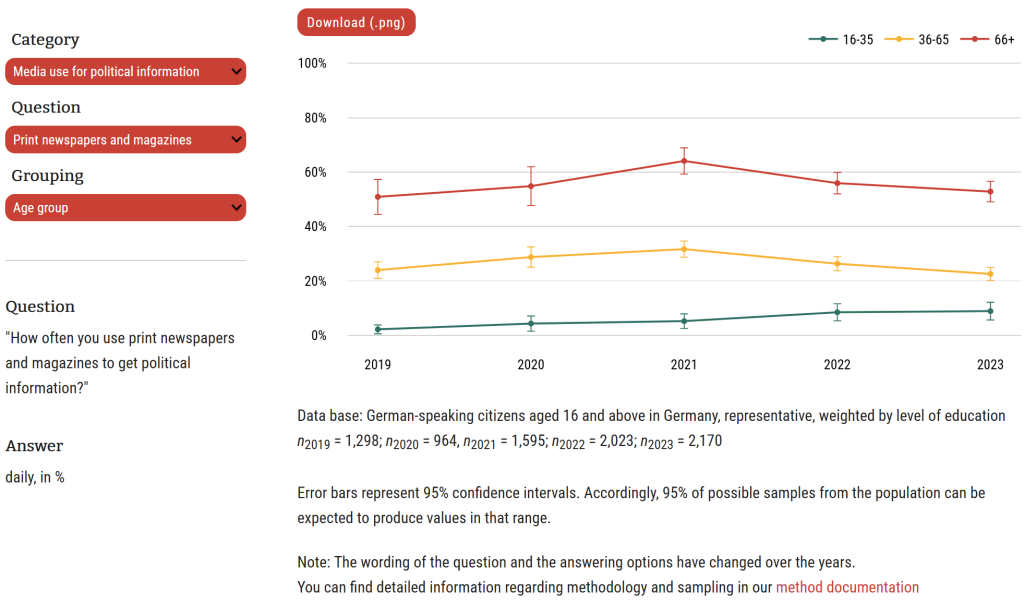
To begin your exploration, simply select a category that piques your interest. Within each category, you will find a selection of questions to delve into. Whether you want to gauge the political news media consumption of the German public, analyze trends in the use of video platforms such as TikTok and Instagram, or find out how often people discuss political issues at work, or with friends and family, the Data Explorer will assist you in this endeavor.
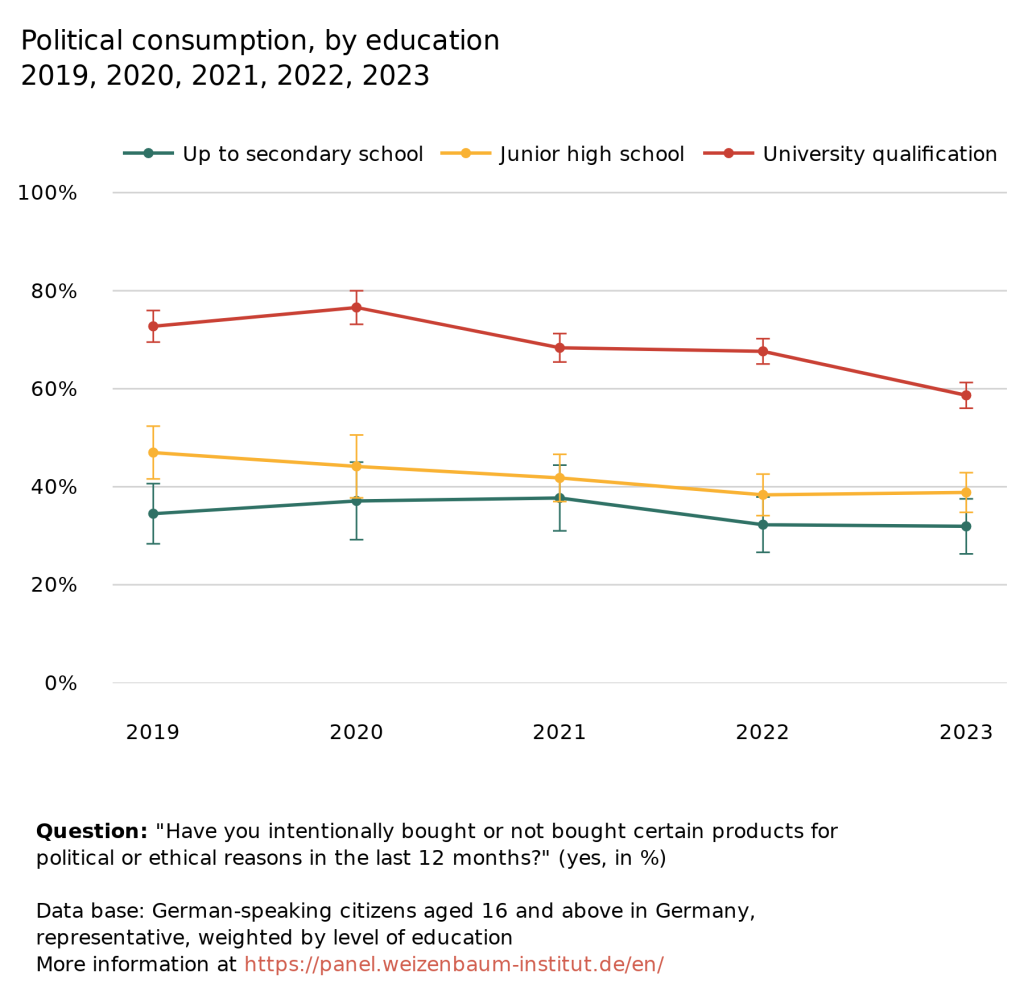
For a nuanced understanding of how different groups within the population engage in social and political activities, you can group the data output by selecting the demographic factors gender, age, level of education, or residence. Moreover, to enhance your experience and facilitate data sharing, you can download any graph in .png format. Each graph includes the question, answering options, and grouping, providing a comprehensive visual representation of the desired data.
The Weizenbaum Data Explorer was developed in Python/Jupyterhub and deployed using Voilà, which are all open-source. It is hosted on Weizenbaum Institute servers, which ensures adequate data protection. This is not the case for typical solutions such as using R Shiny and the deployment platform shinyapps.io. The Data Explorer will be expanded continuously – for example, the fourth wave of the Weizenbaum Panel will be integrated soon.
Whether you’re a researcher, journalist, student, or simply someone curious about Germany’s social and political landscape, the Weizenbaum Panel Data Explorer equips you with the tools to visualize data effortlessly. Happy exploring!